Despite economic slowdown and weakness in consumption, ITC’s Q2FY20 results showed decent growth in profits. The company’s diversified operations across non-cyclical sectors, a resilient business model, a strong brand leadership position in the cigarette business, product innovation track record & premiumization drive are key positives.
Recently ITC launched limited edition chocolate “Trinity Truffles” prior to festive season priced at ₹ 4,30,000 per kg under its Fabelle brand which entered the Guinness World record to become the most expensive chocolate. ITC also plans to set up a modern food processing center in Madhya Pradesh to manufacture listed food brands along with dehydration of vegetables (Investment of ₹ 700 Cr). This shows the commitment of the company to be identified as an FMCG company. Although everywhere in the news articles or in media you will only read or listen to how ITC’s non-cigarette business is growing and how ITC is striving hard to be identified as an FMCG company. “The company’s non-cigarette businesses have grown over 21-fold since 1996,” Sanjiv Puri, chairman of ITC, said in the annual report. In aggregate, the non-cigarette businesses account for over 80% of the company’s operating capital employed, about 90% of the employee base, and over 80% of annual investments. However, if we break down segment revenues and profits, ITC still looks more of a tobacco company than an FMCG company. Though ITC’s revenue from cigarettes is around 46% of the overall revenues, the profits from cigarettes still contribute to about 85% of the overall profits.
So let’s have a look at where ITC stands in the tobacco market, from where it is making the most amount of money.
- ITC is India’s largest buyer, processor, consumer & exporter of cigarette tobacco.
- Pioneering cultivation of flavourful Flue-cured and superior Burley tobaccos in India.
Some important challenges that ITC faces in its cigarette segment are:
- Pressure on legal cigarette industry volumes as more and more illegally smuggled cigarettes are entering Indian markets as they don’t attract any taxes and levies, they are available cheap. “The unfettered growth of illegal cigarettes in the country has caused collateral damage to the Indian tobacco farmers,” said the management in its latest con-call.
- Adverse quality of tobacco leaf due to uncertain weather conditions and leaf cost escalation pertaining to lower output.
- No export incentives available for tobacco exports as are available for other industries.
- Adverse policy stance of government towards the sin sector. After recent corporate tax cuts, it is also expected that the government could levy additional taxes on sin goods to narrow down its fiscal deficit.
On the valuation side, ITC’s sustainable growth rate is 11.81%, average historical cash flow growth is 16%. The discounted cash flow model is giving Intrinsic value of around ₹ 179.79. This price is lower than the current market price because of the higher capital expenditure that ITC is undergoing to expand capacity for its non-cigarette business (one of which is mentioned above) which will eventually lead to higher cash flows in the future. At the current price of ₹ 259, the market is factoring in the cash flow growth of around 22% for the next 10 years.
Is the market expecting enough from ITC? Let’s see how are ITC’s peers placed in terms of valuation.
ITC’s Cigarettes revenue is ₹22,900 cr
ITC is valued at 25x PE
PAT Margins are 67% for cigarettes.
Mcap (alloted to Cigarettes division) ₹2,75,000 cr
Mcap to sales is 12x
VST Industries revenue is ₹1,184 cr (ITC’s revenue is 19 times more)
VST Industries is valued at 23.6x PE
PAT Margins are 19.16%
Mcap ₹6,464 cr
Mcap to sales is 5.9x
Godfrey Phillips revenue is ₹2,700 cr (ITC’s revenue is 8.5 times more)
Godfrey is valued at 23.2x PE
PAT Margins are 9.6%
Mcap ₹5,960 cr
Mcap to sales is 2.2 x
Since ITC is the market leader in cigarettes, it should see P/E expansion over it’s peers. VST industries hit all time high on 8th November (Does that mean anything for ITC?).
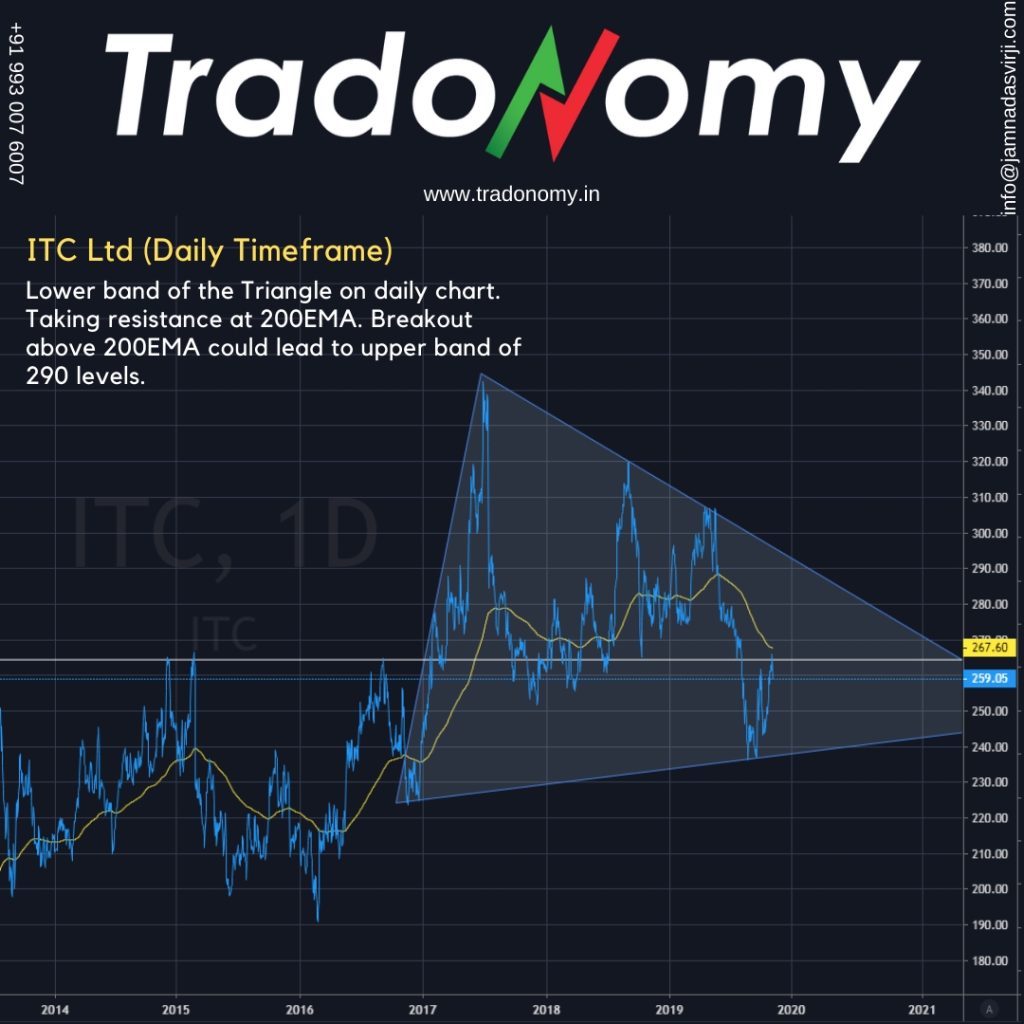
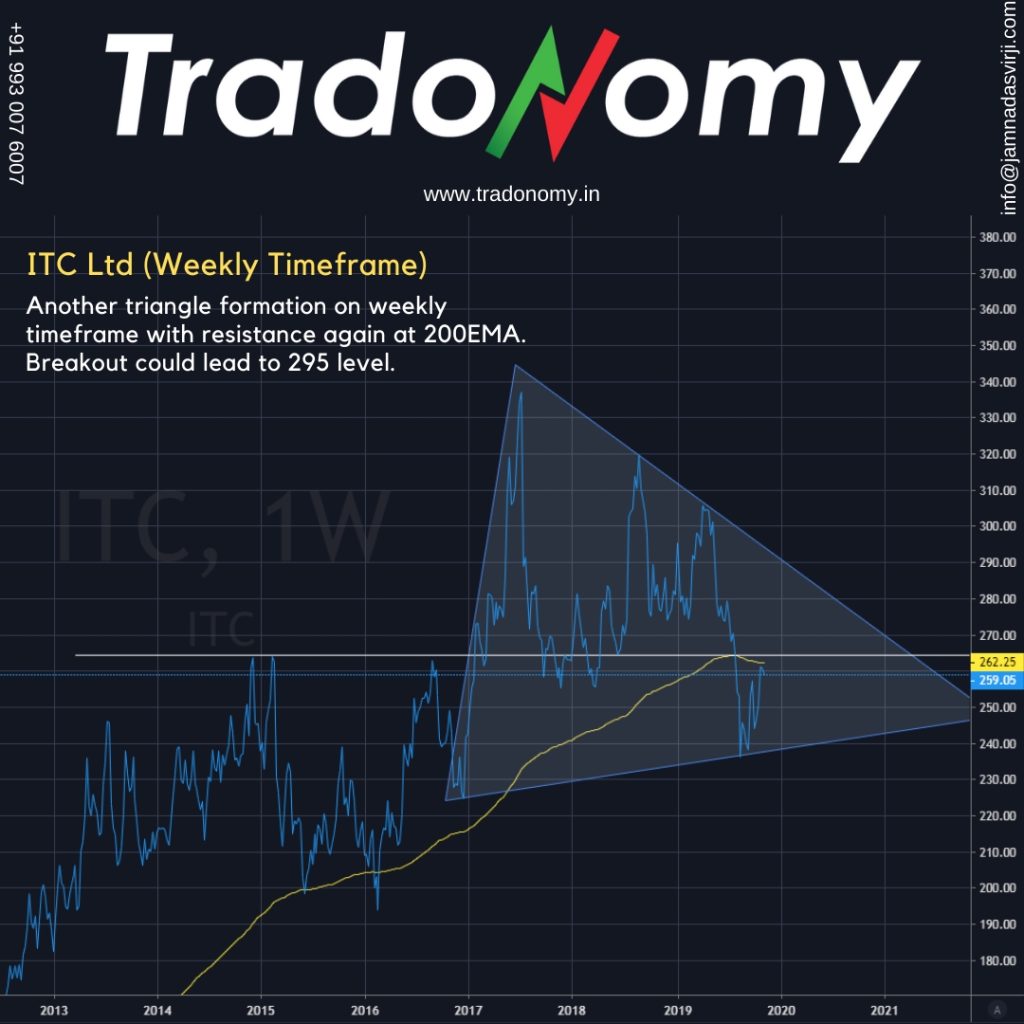
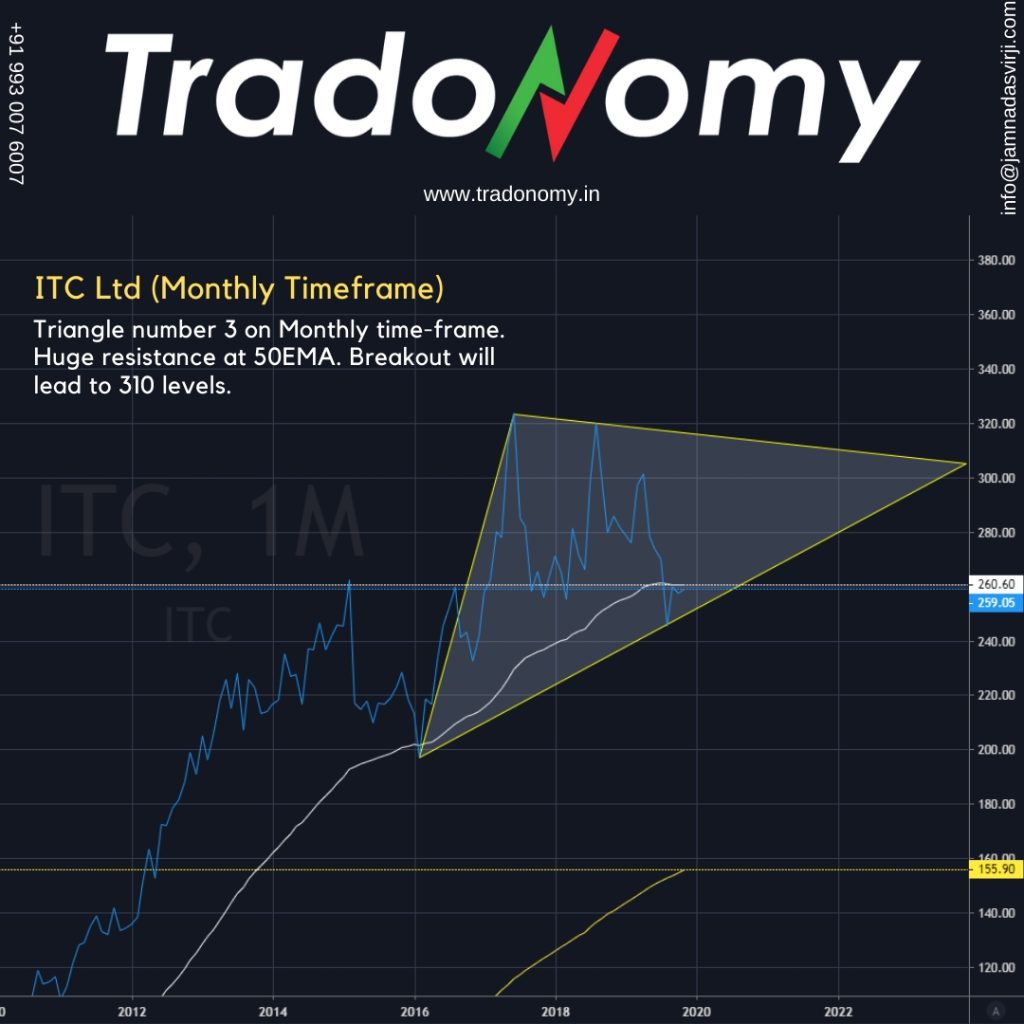
To have a 360 degree perspective, let us understand how ITC stands on technical charts. Below are the three charts for ITC on three time frames i.e. Daily, Weekly and Monthly