
Does the Price to Earnings (P/E) ratio really give us any indication as to whether a stock is under/overvalued?
Several interpretations can be made from observing PE:
It shows the number of years over which the company needs to sustain its earnings so as to make enough money to pay back the current share price to its shareholders.
If current PE of any stock is higher than the historical PE of that stock it could mean that the stock is overvalued or that the investors are anticipating higher growth in the future.
Lower PE could mean that the investors are either anticipating lower growth or that the company’s performance has improved but prices are yet to catch up.
As you can notice there is a lot of confusion and under confidence when using standalone PE ratio for investment decisions. However, there are several other methods that can be used in a more logical way to arrive at a better conclusion.
1. ISPE ratio- This is the ratio between PE ratio of Index and of a stock (ISPE ratio = PE of Index/ PE of stock). When using this ratio, one can compare over the period of a few years as to whether a stock’s PE has gone up or down in relation to Index’s PE to which it belongs. Interpreting this ratio is easy if a stock’s ISPE ratio has gone up substantially, it means that the growth in the stock’s price is not in sync with the market and can be assumed that the underlying business is not so strong. Similarly, if a stock’s ISPE ratio came down substantially, it again means that the growth in the stock’s price is not in sync with the market and there are two possibilities, the prices are either in an overbought zone or the prices have not caught up to deteriorating fundamentals. Ideally, the ISPE ratio should be between 0.7 to 1.3 times. Below tables show ISPE ratio for Nifty 50 Index stocks (Excluding Banks and NBFC)

All FMCG stocks have ISPE ratio below 0.7, in such a scenario we need to also consider the PEG ratio, which is explained below.
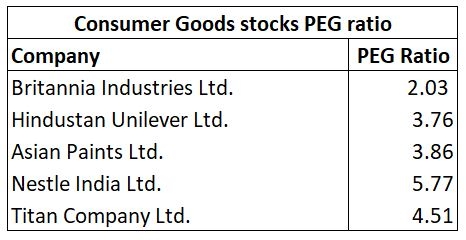
2. PEG Ratio – This ratio measures PE with respect to the company’s growth to make PE comparable among companies with different growth rates (PEG Ratio = PE/ Sustainable growth rate). As companies with higher growth command higher PE compared to companies with lower growth, the PEG ratio helps to arrive at a more reasonable judgment about whether a stock is undervalued or overvalued. PEG ratio of more than 2 shows excessive exuberance in any stock and certainly means they are overvalued. The below table shows the PEG ratio of consumer goods stocks that are part of the Nifty 50 index.
That for sure does not mean that you should go out and short them, as famously said: “Markets can remain irrational for periods longer than you can remain solvent”.