Who’s stars are shining brightest this year?
After the historic announcement of corporate tax cuts, India’s ranking in top-performing markets saw a massive bump.
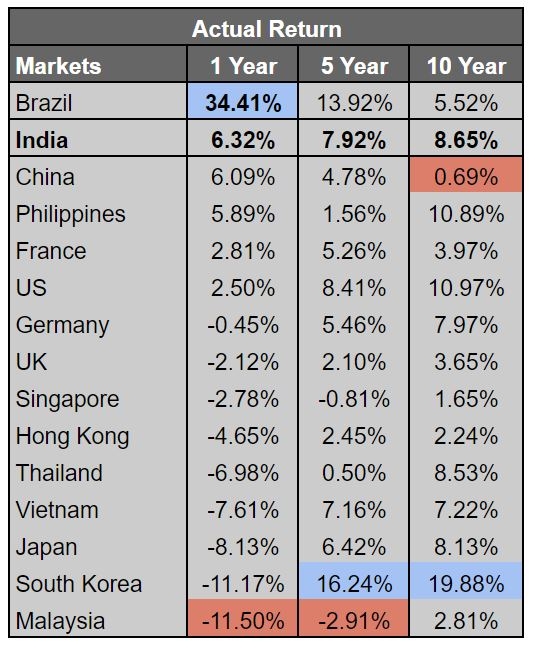
Below table lists out the equity market performance of various countries in last 1 year, 5 years, and 10 years. It shows the actual return of various markets in their respective currencies. It can be observed that with respect to 1 year return, India now has the 2nd best performing equity market among its peers. However on a 10 year return basis, South Korea is the best performer followed by US, Philippines and India which is at fourth position.

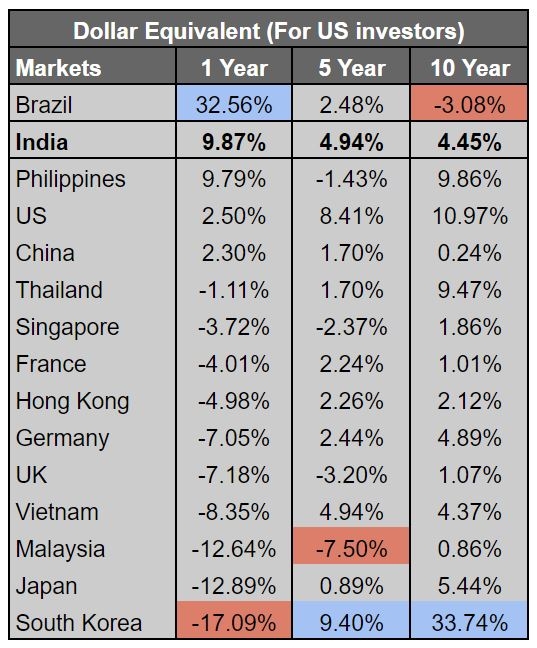
If we compare all the markets on a common ground, i.e. return in Dollar denominated terms, India still stands as having 2nd best performing stock market among its peers. However, in terms of 10 year’s return, South Korea again has the best performing stock market, followed by US. India stands at 7th position. Below table shows the same.

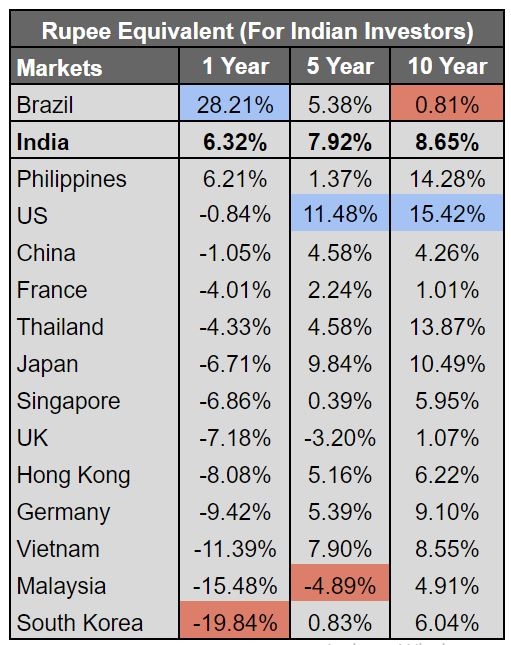
All said and done, what does it mean for an Indian investor? The below table shows the return in Rupee equivalent terms, meaning if any Indian investor invests in these markets then, taking rupee appreciation/depreciation into consideration what would be the return. On a 1-year return basis, India still stands 2nd in terms of performance. It could also be noticed that for an Indian investor, investing in only 2 other markets would have been profitable, i.e Brazil and the Philippines, rest all other markets performed poorly, in fact investing in them would have incurred losses in rupee equivalent terms. However, on a 10-year return basis, investing in US markets would have yielded the highest return both because of good performance of US equities as well as Dollar appreciation. Other countries where an Indian investor received good returns were the Philippines, Thailand, Japan, and Germany. The important limitation to understand here is that Indian individuals can make offshore investments up-to USD 250,000 annually under the liberalised remittance scheme (LRS). Investments above these thresholds require specific approval from the RBI.

Note:
Calculations made are based on prices of Indices of respective countries and rates of currencies as on 23 Sep 2019, 24 Sep 2018, 29 Sep 2014 and 30 Sep 2009.
Return shown in all tables is Compounded Annual Growth Rates (CAGR).
