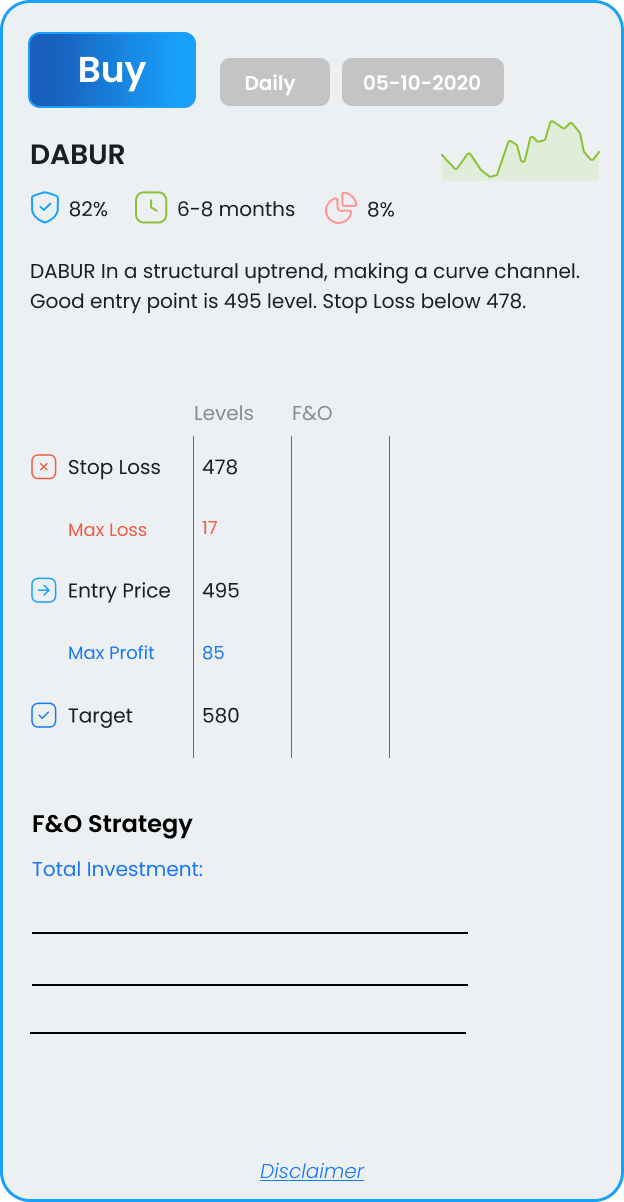
DABUR
In a structural uptrend, making a curve channel. Good entry point is 495 level. Stop Loss below 478.
In a structural uptrend, making a curve channel. Good entry point is 495 level. Stop Loss below 478.
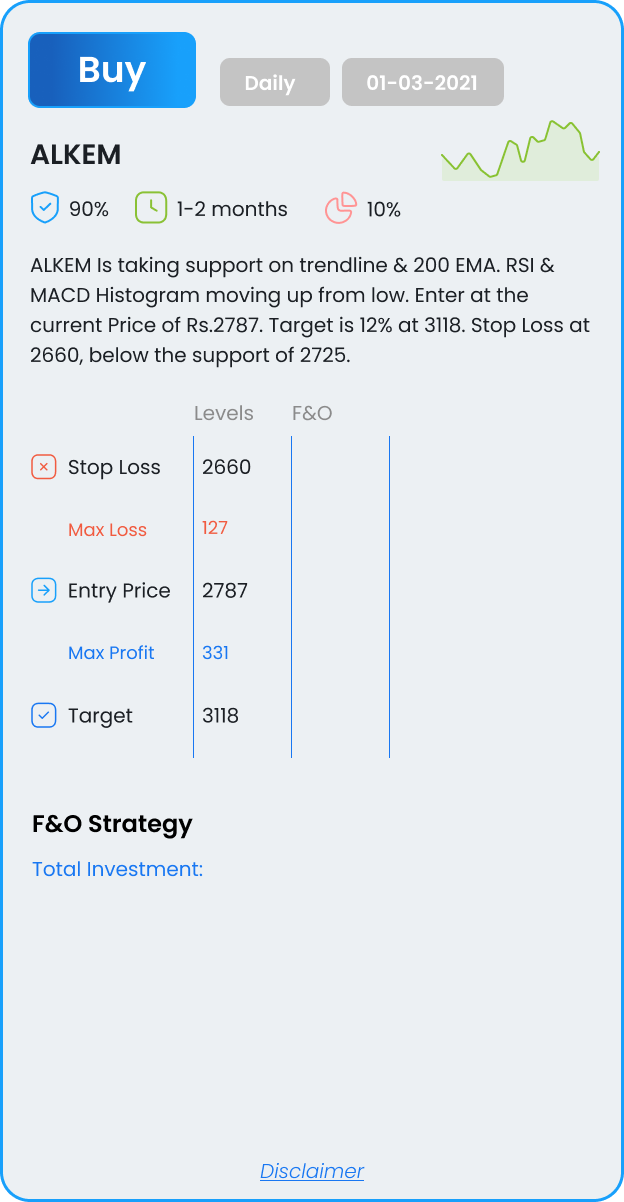
Is taking support on trendline & 200 EMA. RSI & MACD Histogram moving up from low. Enter at the current Price of Rs.2787. Target is 12% at 3118. Stop Loss at 2660, below the support of 2725.
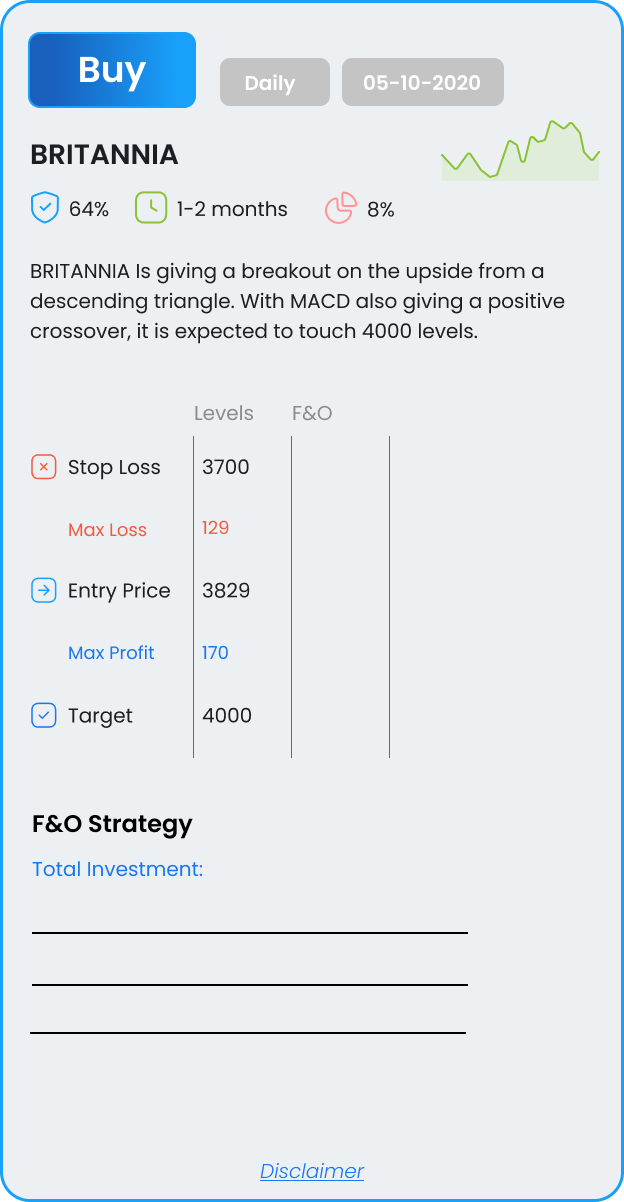
Is giving a breakout on the upside from a descending triangle. With MACD also giving a positive crossover, it is expected to touch 4000 levels.
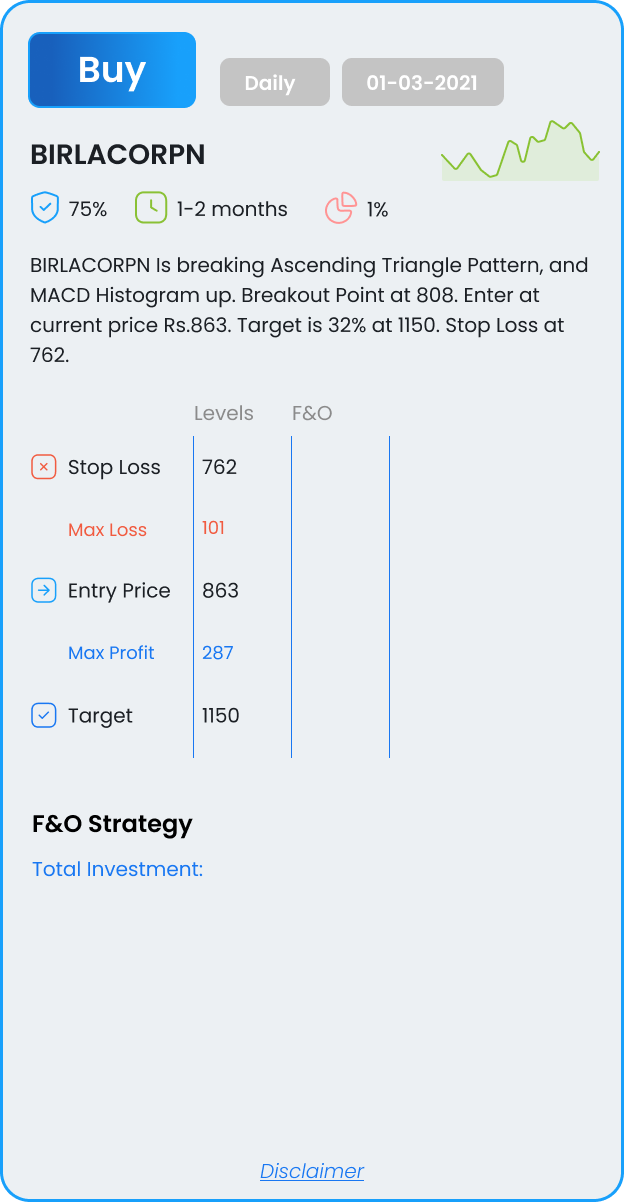
Is breaking Ascending Triangle Pattern, and MACD Histogram up. Breakout Point at 808. Enter at the current price of Rs.863. Target is 32% at 1150. Stop Loss at 762.
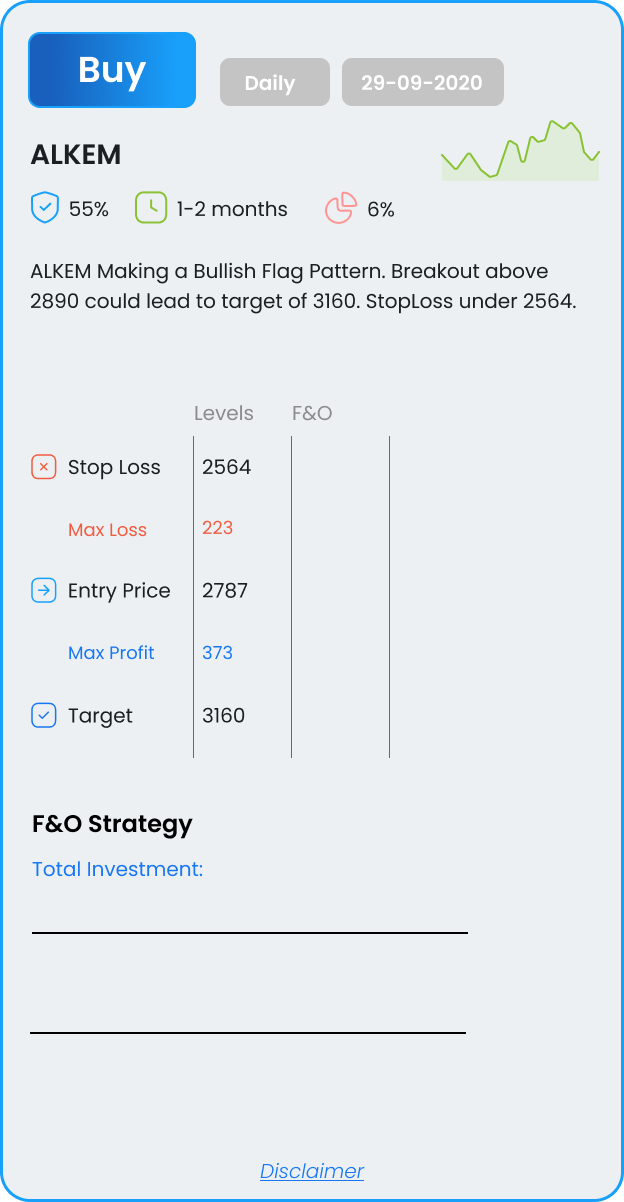
Making a Bullish Flag Pattern. Breakout above 2890 could lead to target of 3160. StopLoss under 2564.
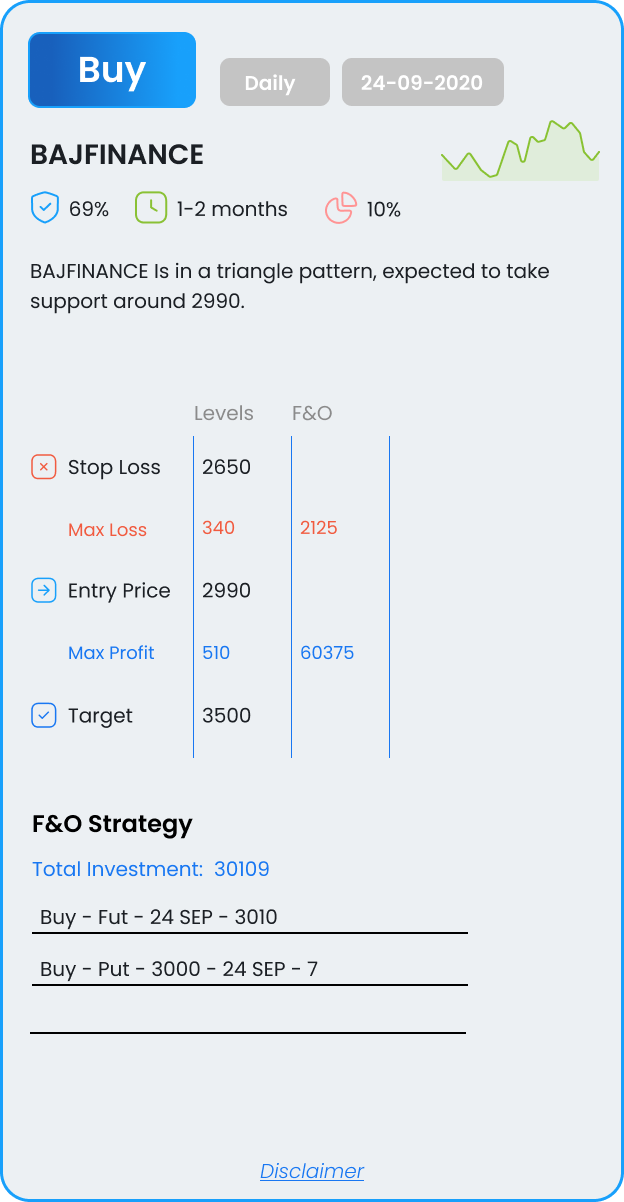
Is in a triangle pattern, expected to take support around 2990.
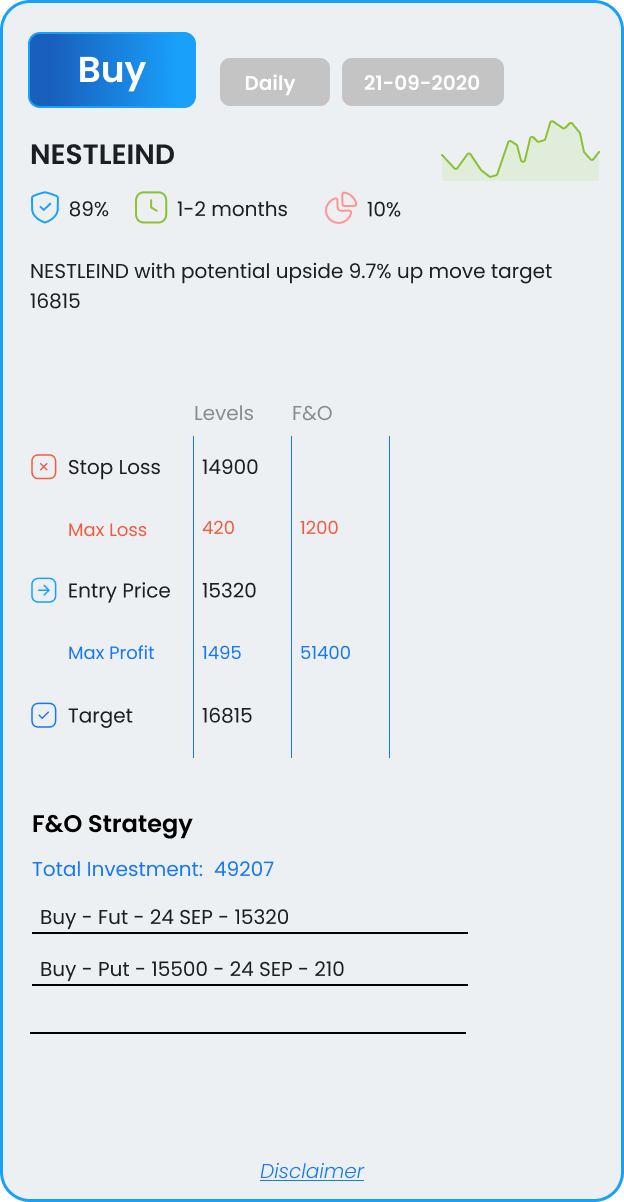
Strong support near 15000, with potential upside 9.7% up move target 16815
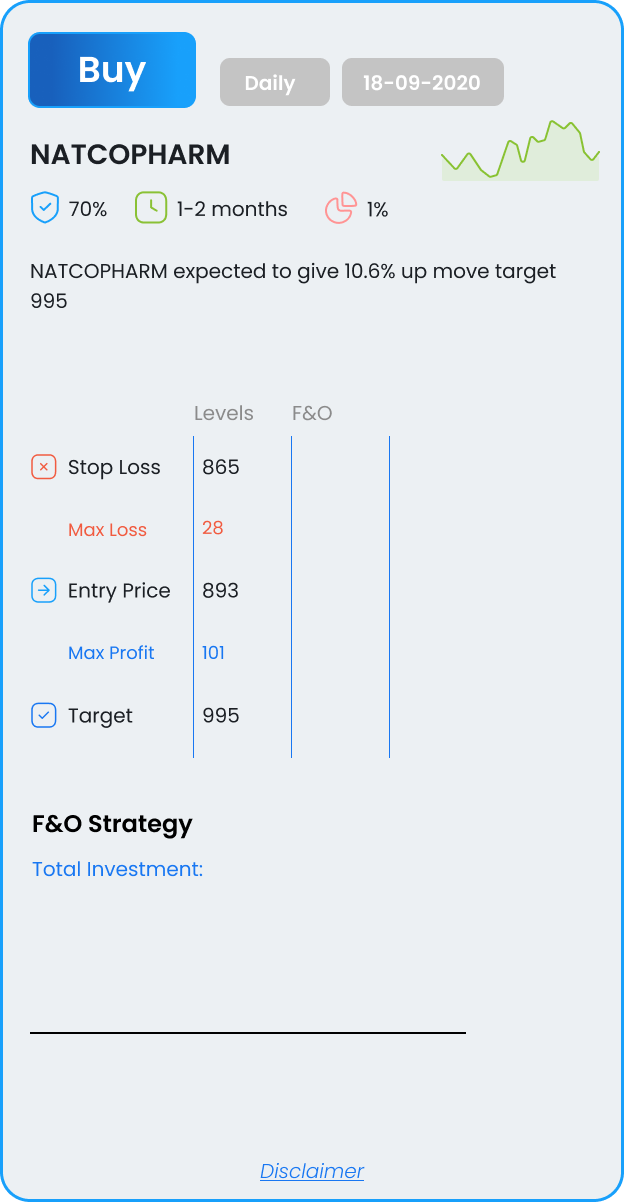
expected to give a 10.6% up move with the target 995. Strict Stoploss @ Rs. 865.
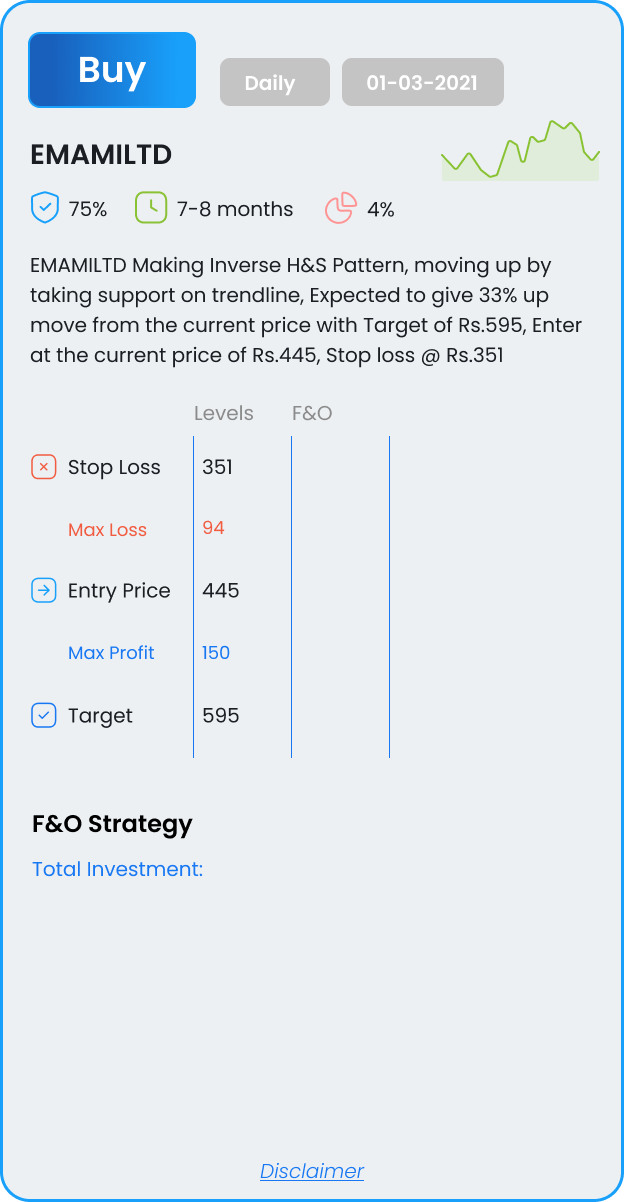
Making Inverse H&S Pattern, moving up by taking support on trendline, Expected to give 33% up move from the current price with Target of Rs.595, Enter at the current price of Rs.445, Stop loss @ Rs.351
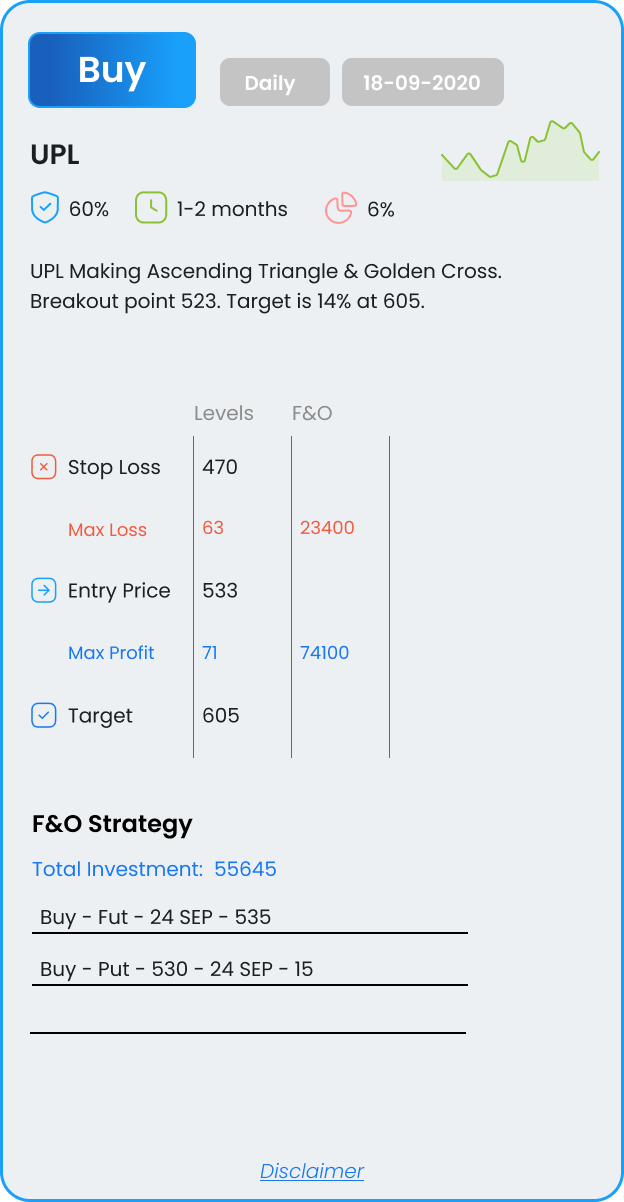
Making Ascending Triangle & Golden Cross. Breakout point 523. Target is 14% at 605.