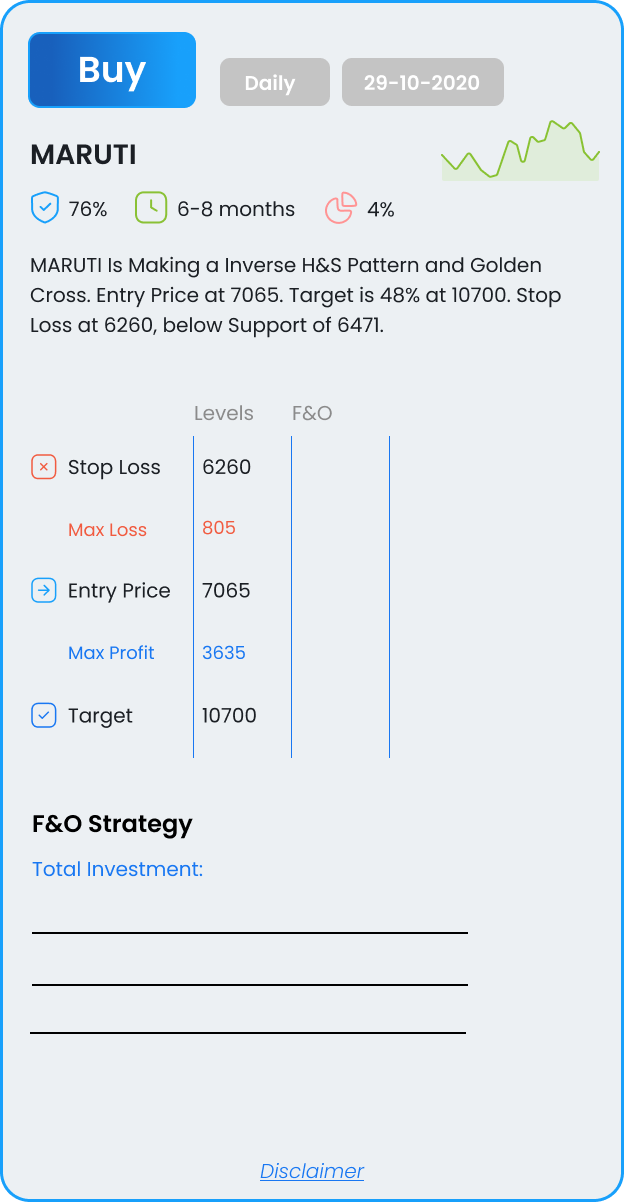
MARUTI
Is Making a Inverse H&S Pattern and Golden Cross. Entry Price at 7065. Target is 48% at 10700. Stop Loss at 6260, below Support of 6471.

Is Making a Inverse H&S Pattern and Golden Cross. Entry Price at 7065. Target is 48% at 10700. Stop Loss at 6260, below Support of 6471.
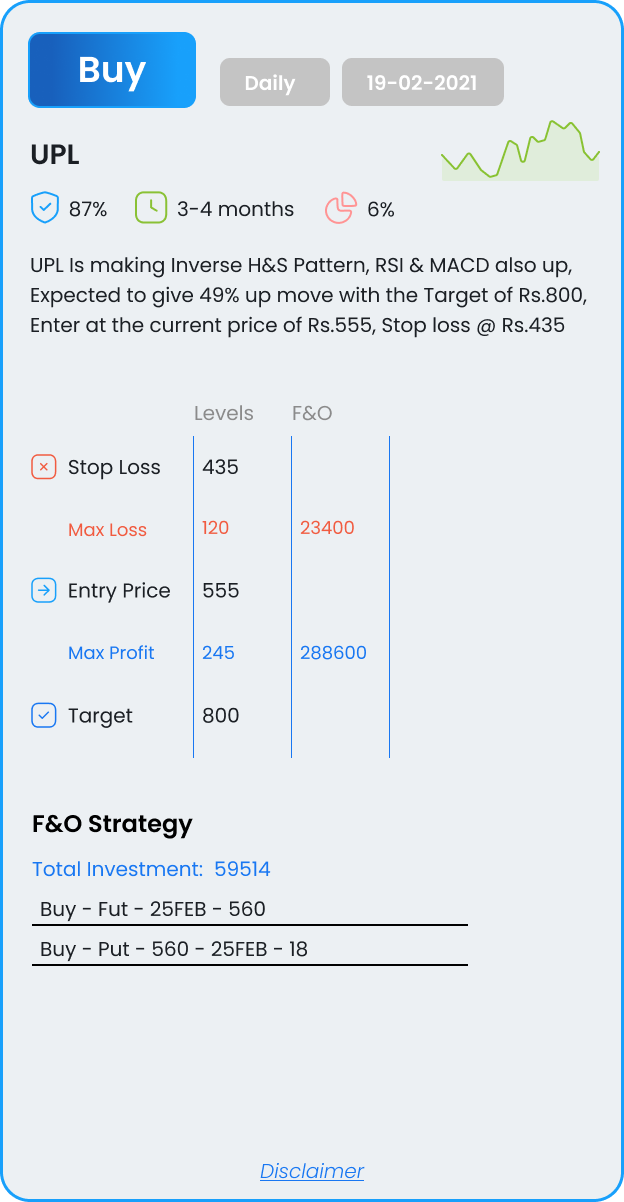
Is making Inverse H&S Pattern, RSI & MACD also up, Expected to give 49% up move with the Target of Rs.800, Enter at the current price of Rs.555, Stop loss @ Rs.435
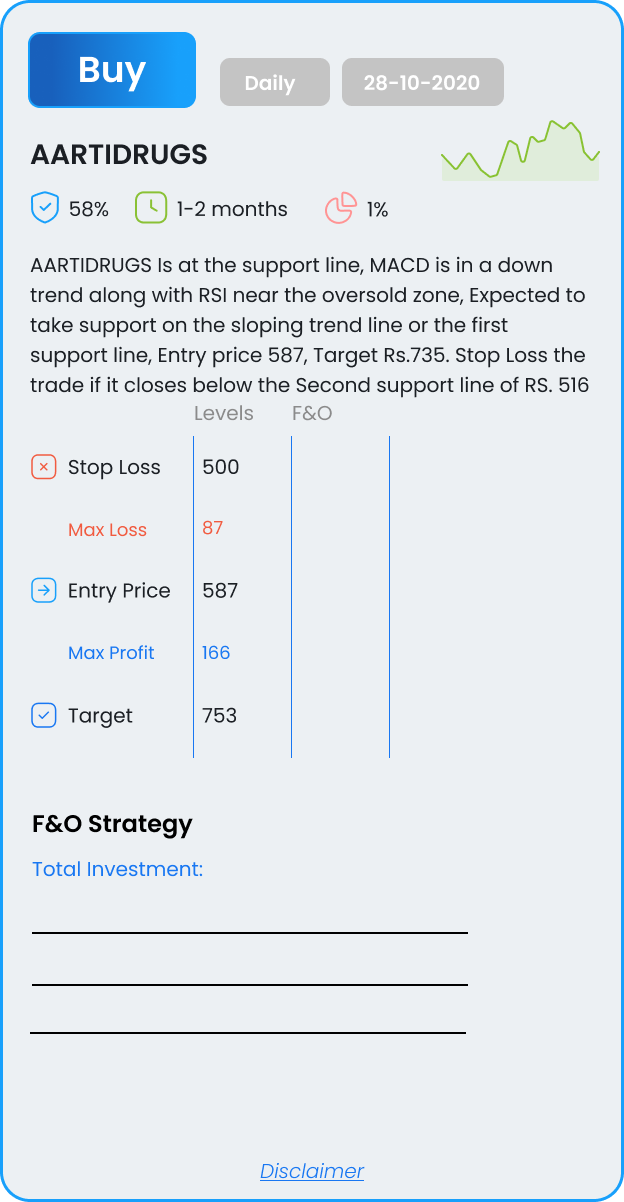
Is at the support line, MACD is in a down trend along with RSI near the oversold zone, Expected to take support on the sloping trend line or the first support line, Entry price 587, Target Rs.735. Stop Loss the trade if it closes below the Second support line of RS. 516
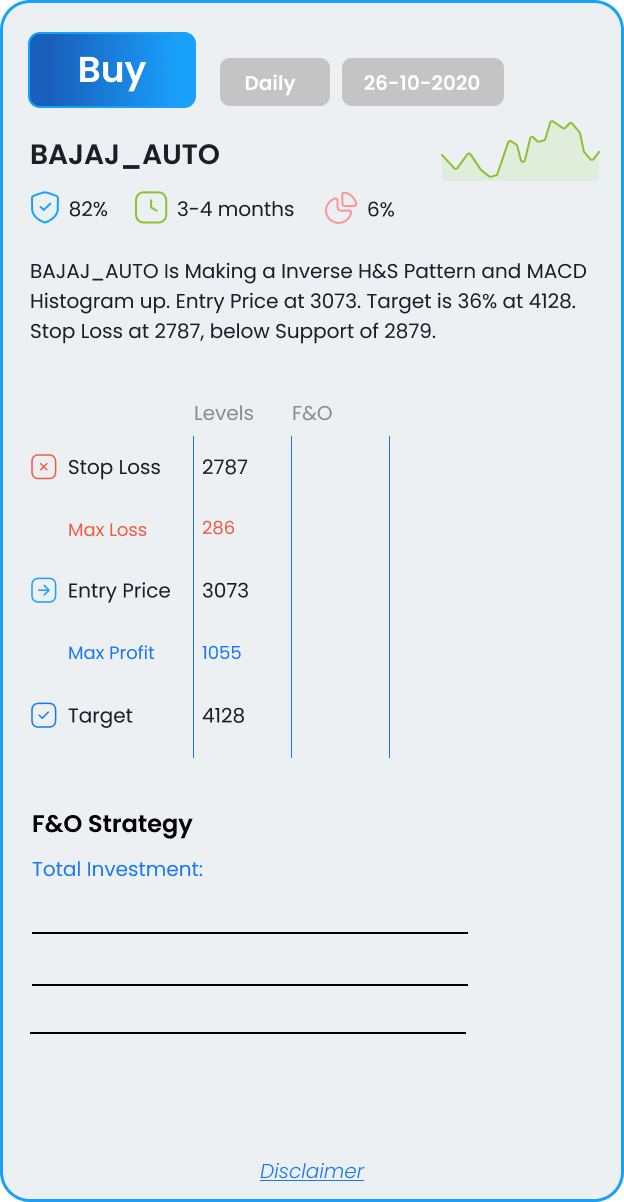
Is Making an Inverse H&S Pattern and MACD Histogram up. Entry Price at 3073. Target is 36% at 4128. Stop Loss at 2787, below Support of 2879.
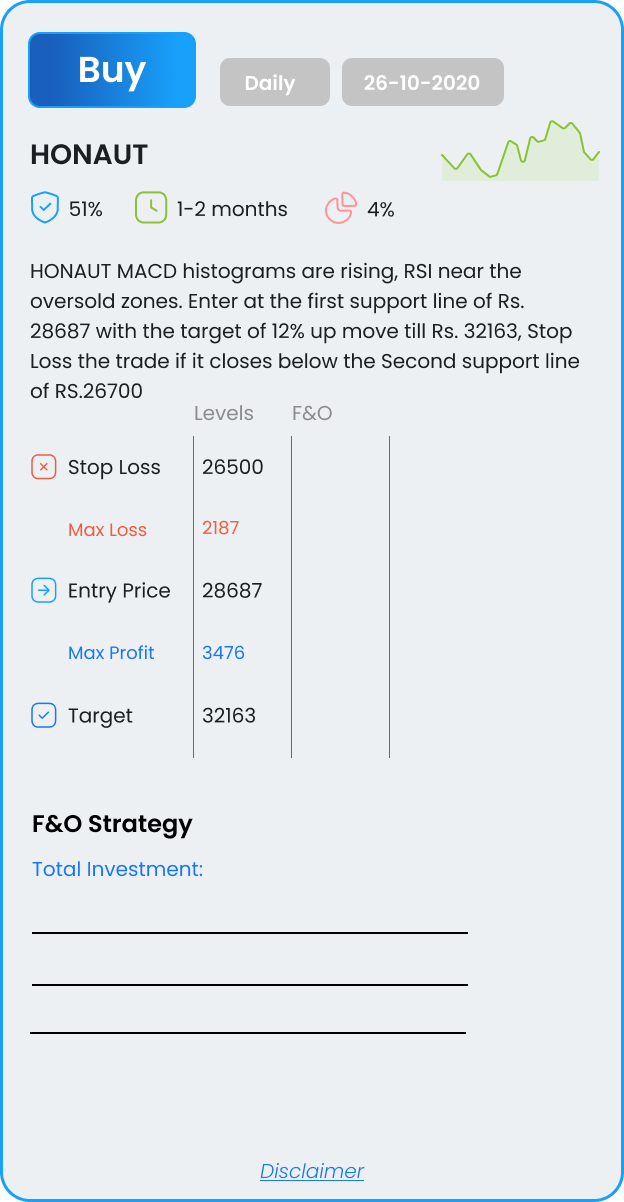
MACD histograms are rising, RSI near the oversold zones. Enter at the first support line of Rs. 28687 with the target of 12% up move till Rs. 32163, Stop Loss the trade if it closes below the Second support line of RS.26700
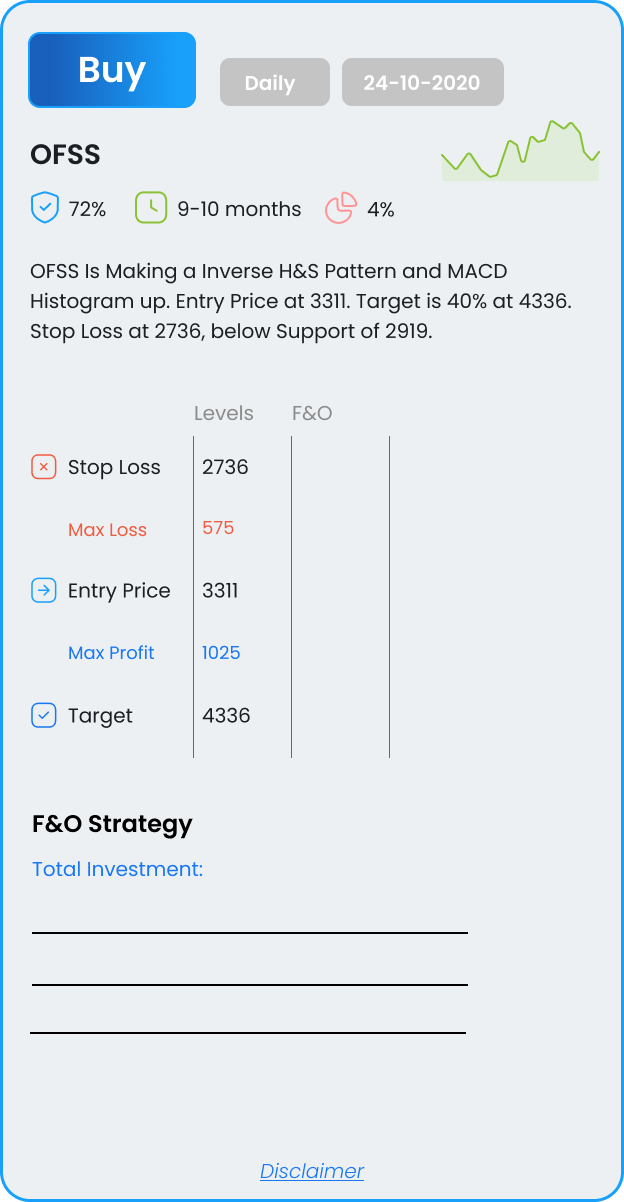
Is Making a Inverse H&S Pattern and MACD Histogram up. Entry Price at 3311. Target is 40% at 4336. Stop Loss at 2736, below Support of 2919.
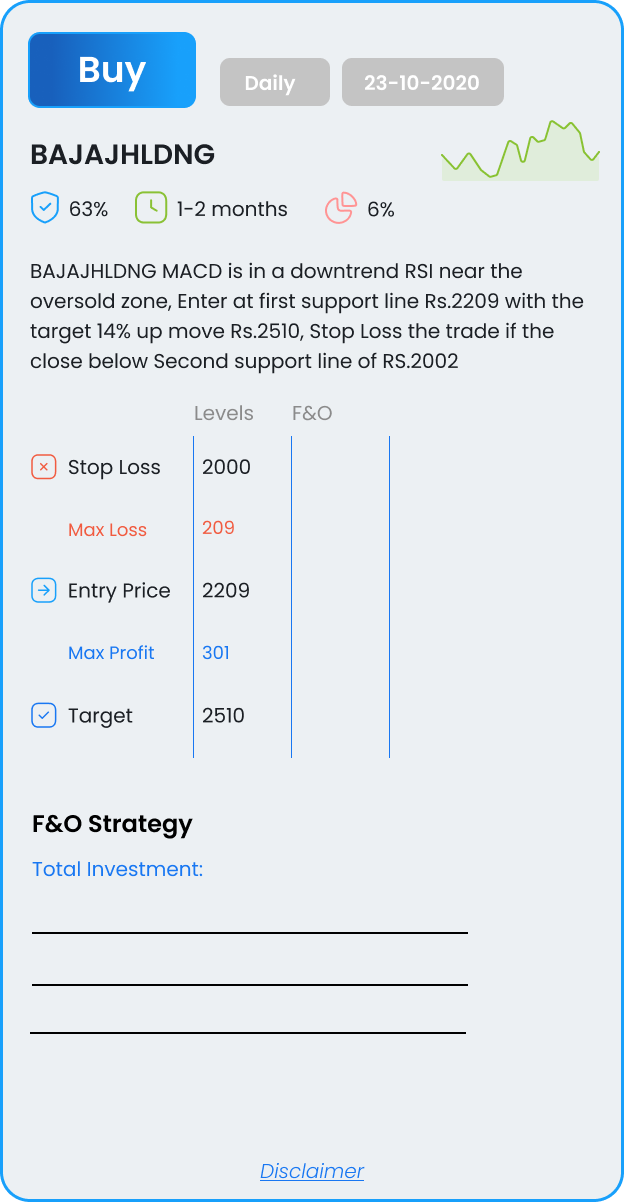
MACD is in a downtrend RSI near the oversold zone, Enter at first support line Rs.2209 with the target 14% up move Rs.2510, Stop Loss the trade if the close below Second support line of RS.2002
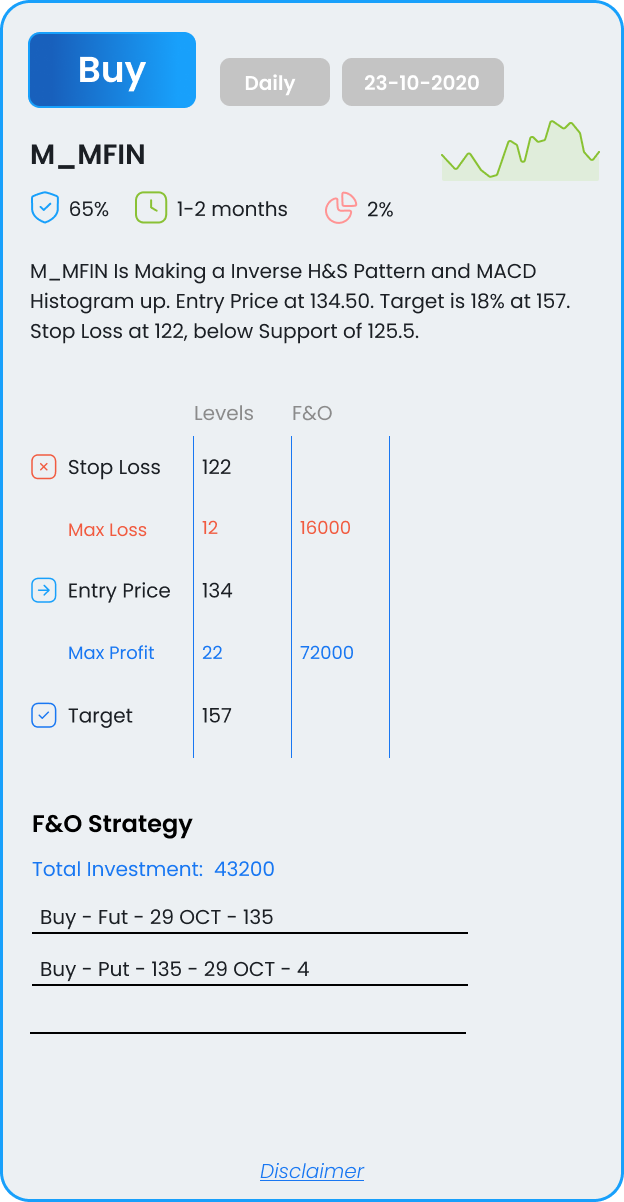
Is Making a Inverse H&S Pattern and MACD Histogram up. Entry Price at 134.50. Target is 18% at 157. Stop Loss at 122, below Support of 125.5.
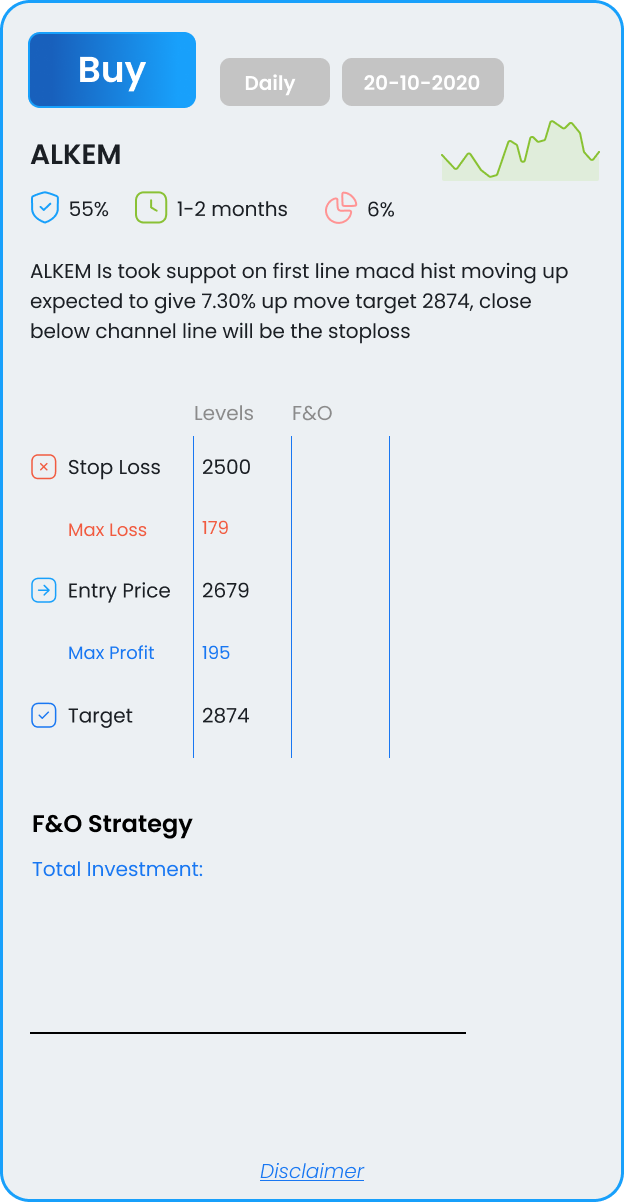
took suppot on first line macd hist moving up expected to give 7.30% up move target 2874, close below channel line will be the stoploss
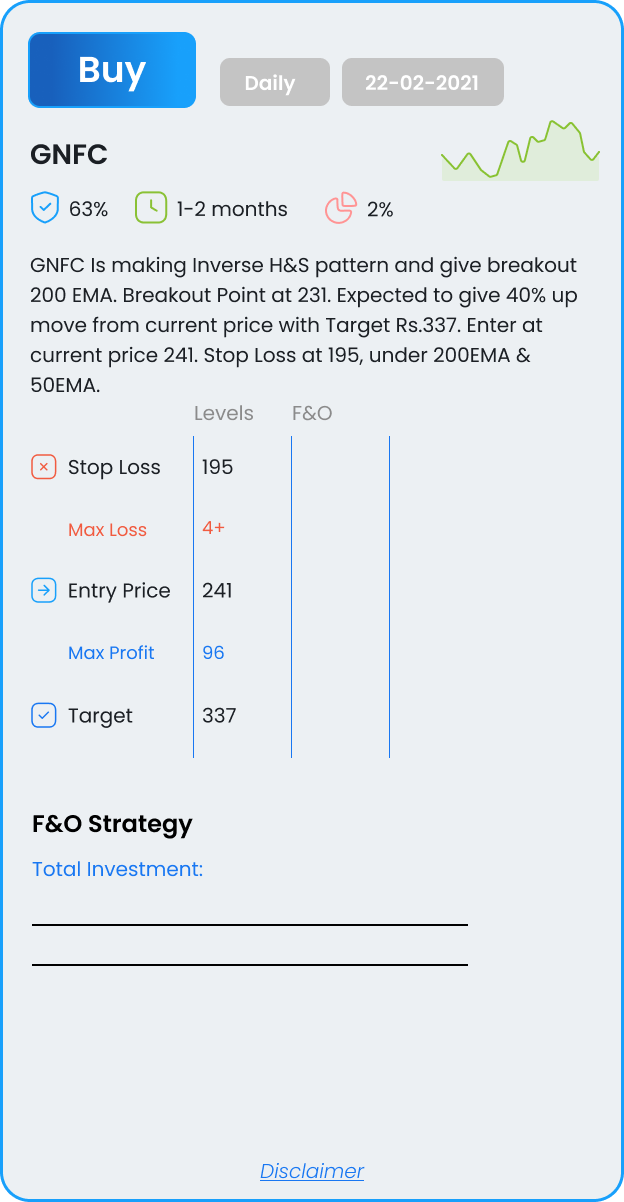
Is making an Inverse H&S pattern and giving breakout 200 EMA. Breakout Point at 231. Expected to give 40% up move from current price with Target Rs.337. Enter at current price 241. Stop Loss at 195, under 200EMA & 50EMA.