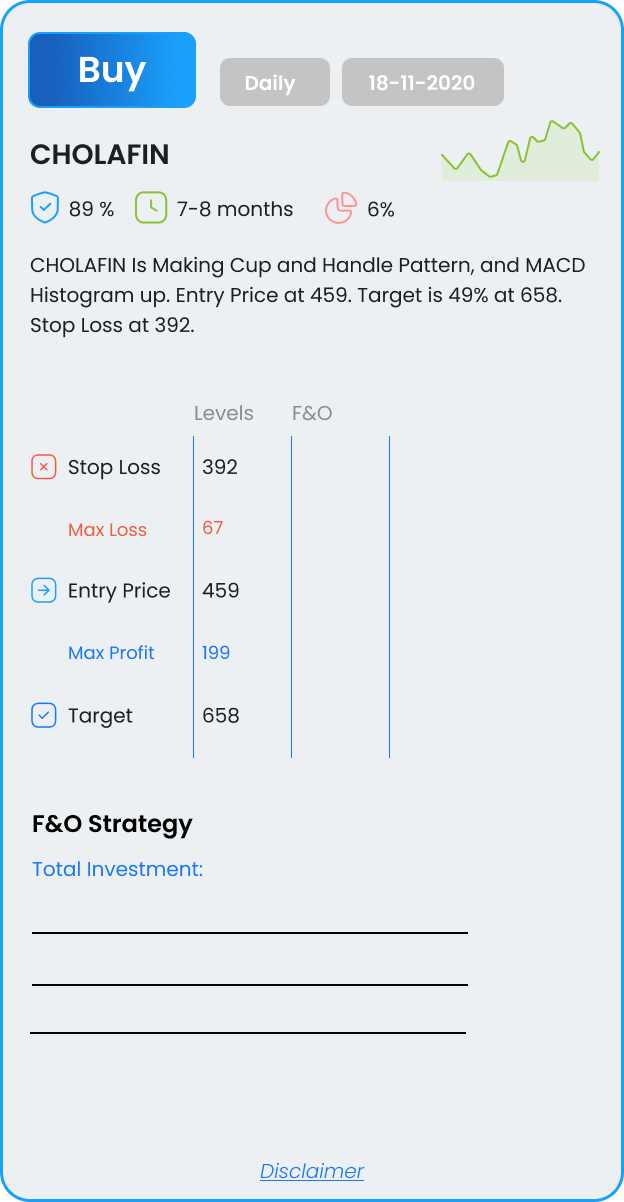
CHOLAHLDNG
Is Making Cup and Handle Pattern, and MACD Histogram up. Entry Price at 459. Target is 49% at 658. Stop Loss at 392.

Is Making Cup and Handle Pattern, and MACD Histogram up. Entry Price at 459. Target is 49% at 658. Stop Loss at 392.
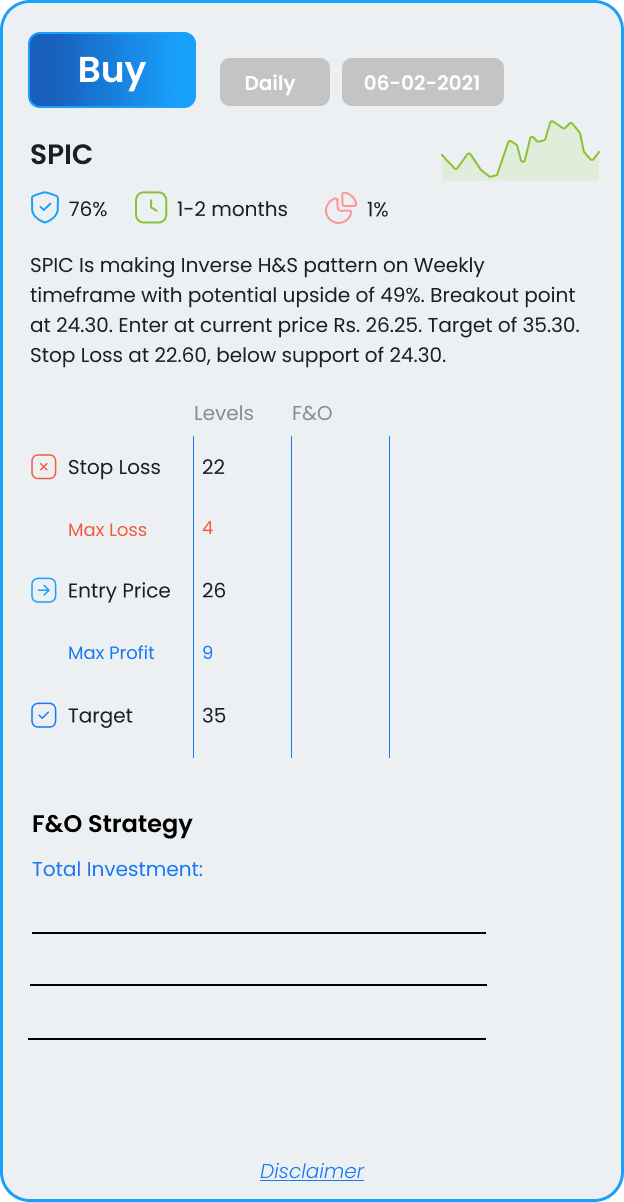
Is making an Inverse H&S pattern on a Weekly timeframe with a potential upside of 49%. Breakout point at 24.30. Enter at the current price of Rs. 26.25. The target of 35.30. Stop Loss at 22.60, below the support of 24.30.
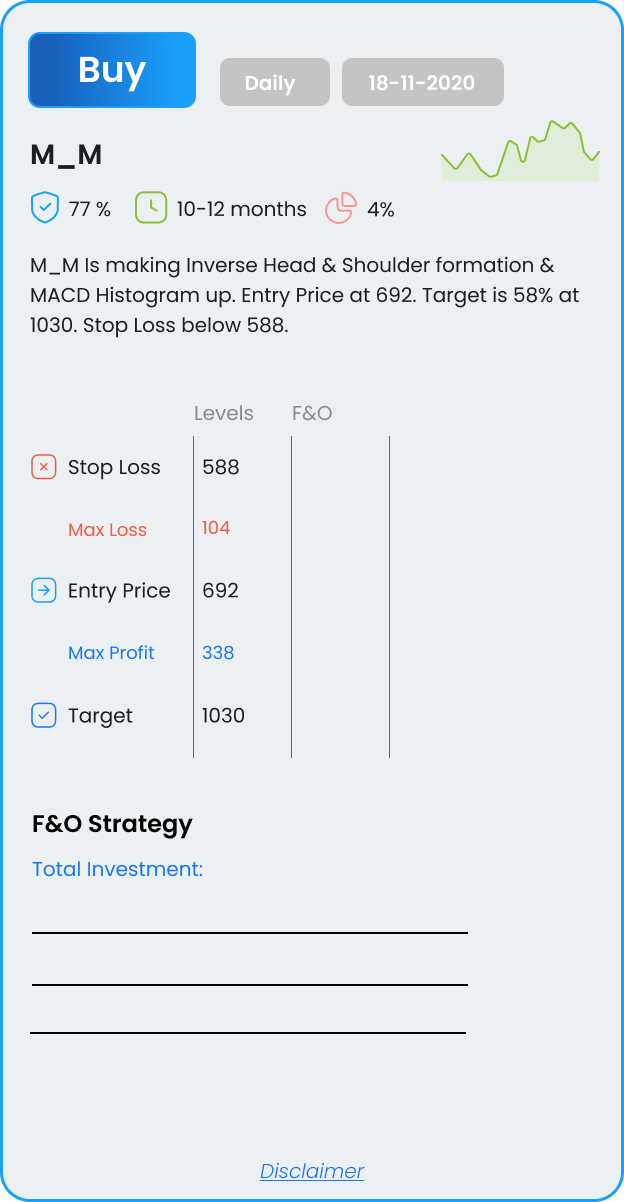
Is making Inverse Head & Shoulder formation & MACD Histogram up. Entry Price at 692. Target is 58% at 1030. Stop Loss below 588.
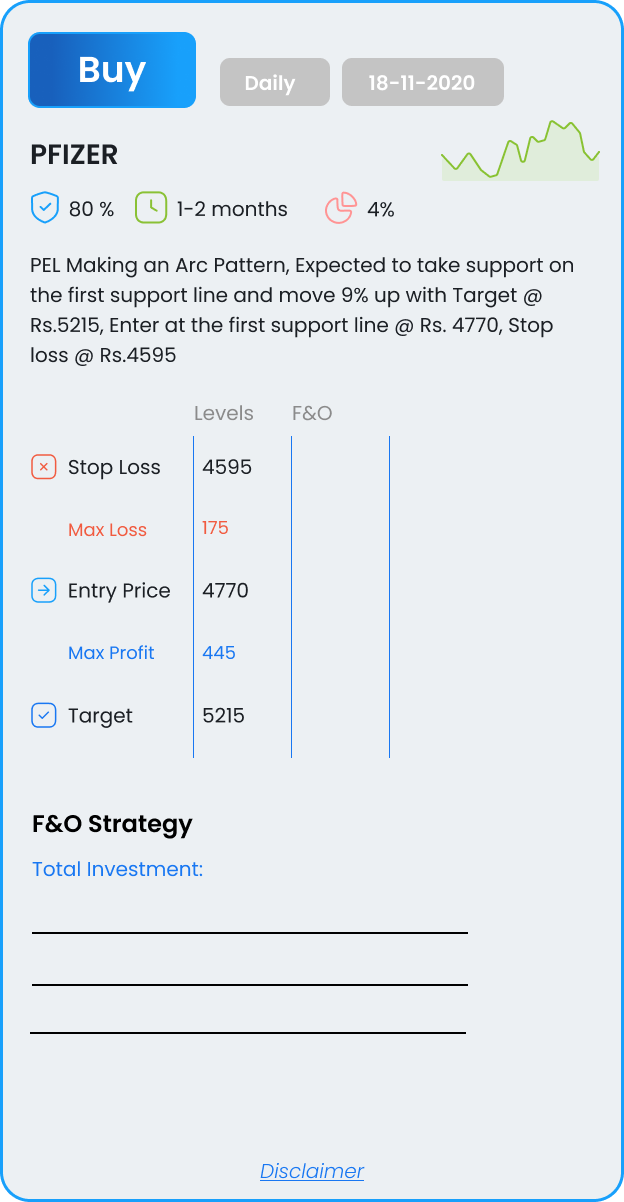
Making an Arc Pattern, Expected to take support on the first support line and move 9% up with Target @ Rs.5215, Enter at the first support line @ Rs. 4770, Stop loss @ Rs.4595
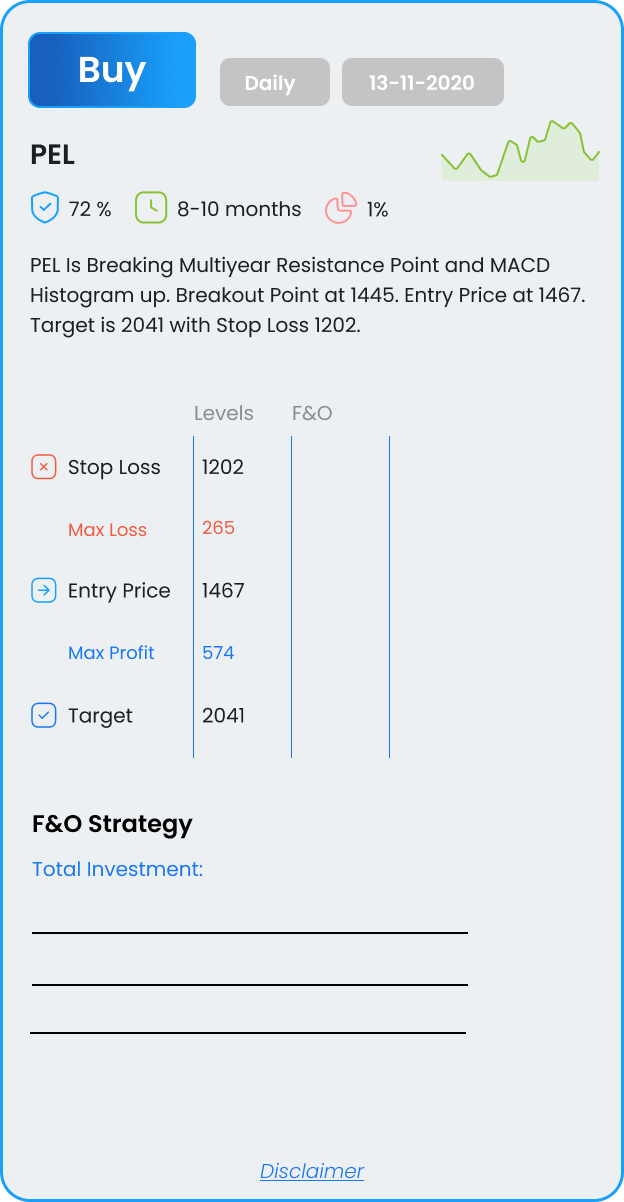
Is Breaking Multiyear Resistance Point and MACD Histogram up. Breakout Point at 1445. Entry Price at 1467. Target is 2041 with Stop Loss 1202.
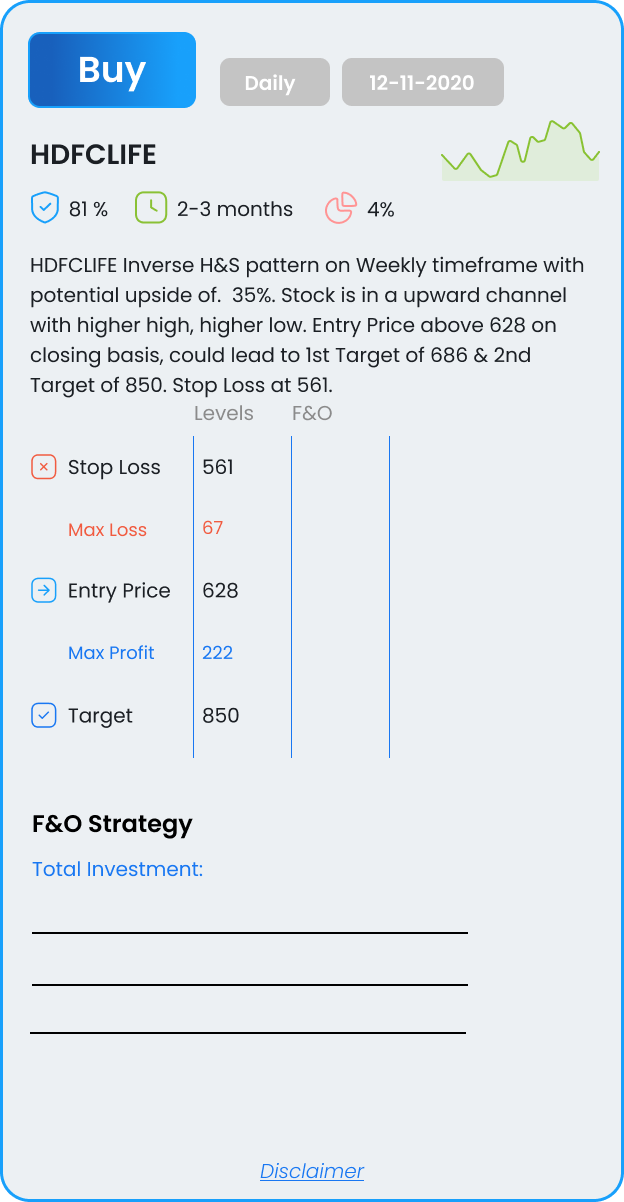
Inverse H&S pattern on Weekly timeframe with potential upside of. 35%. Stock is in a upward channel with higher high, higher low. Entry Price above 628 on closing basis, could lead to 1st Target of 686 & 2nd Target of 850. Stop Loss at 561.
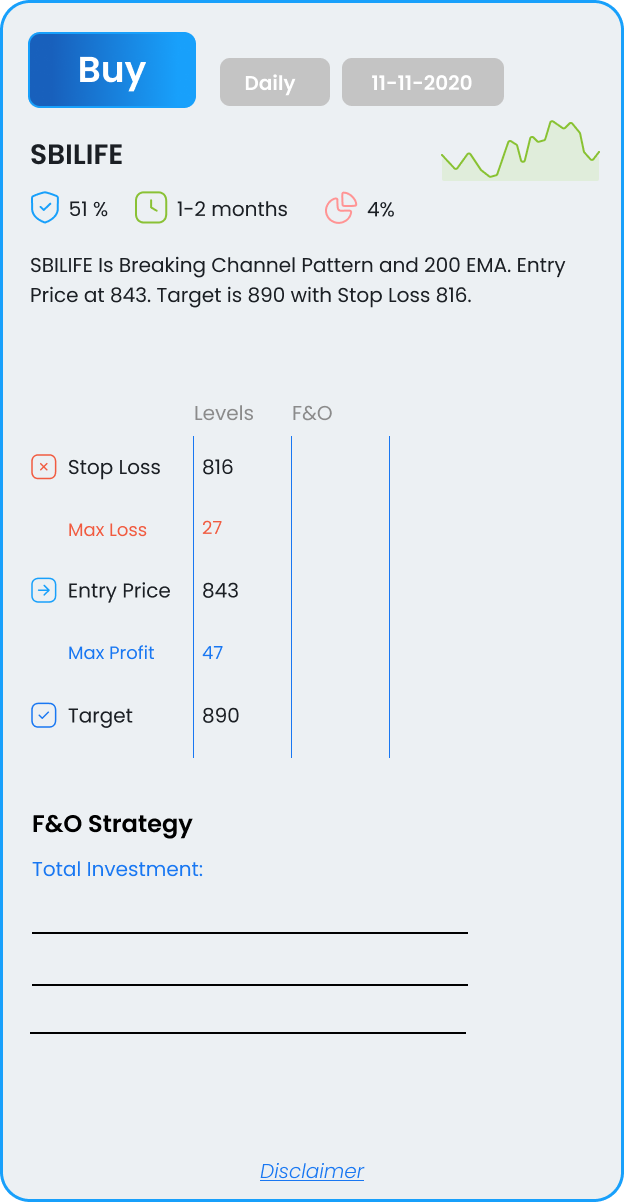
Is Breaking Channel Pattern and 200 EMA. Entry Price at 843. Target is 890 with Stop Loss 816.
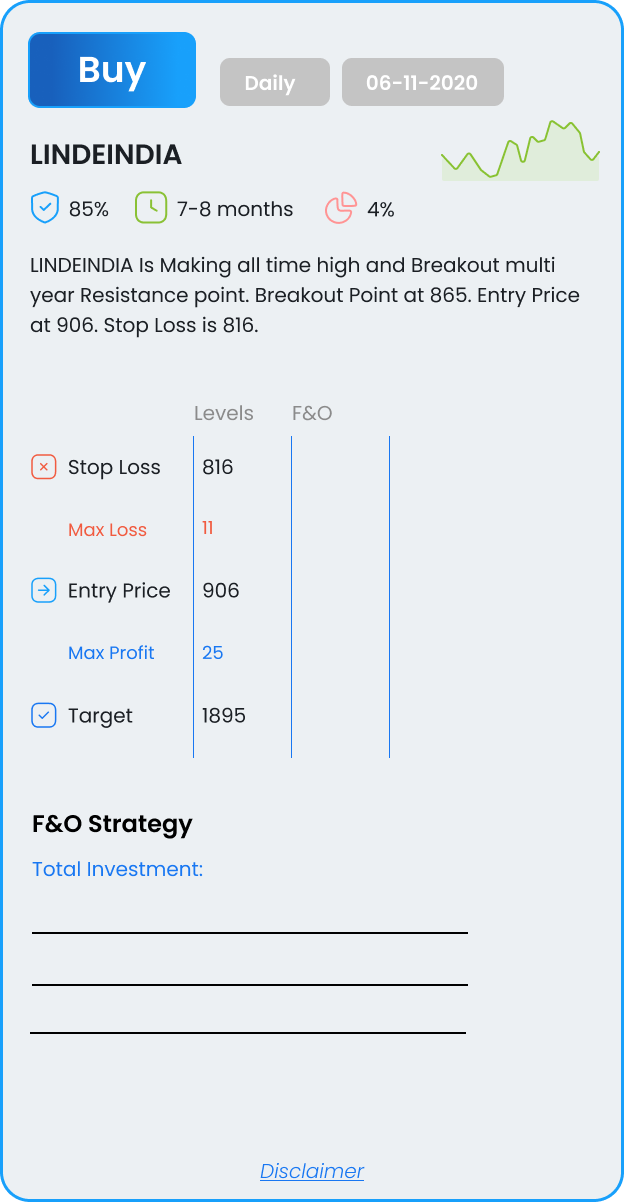
Is Making all time high and Breakout multi year Resistance point. Breakout Point at 865. Entry Price at 906. Stop Loss is 816.
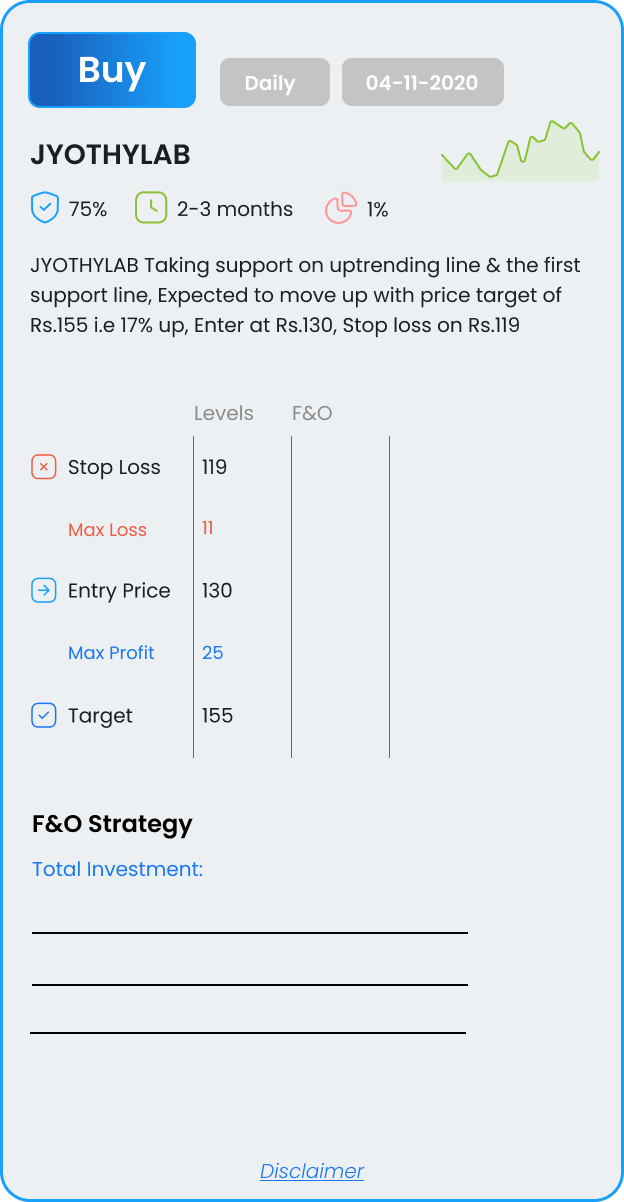
Taking support on uptrending line & the first support line, Expected to move up with price target of Rs.155 i.e 17% up, Enter at Rs.130, Stop loss on Rs.119
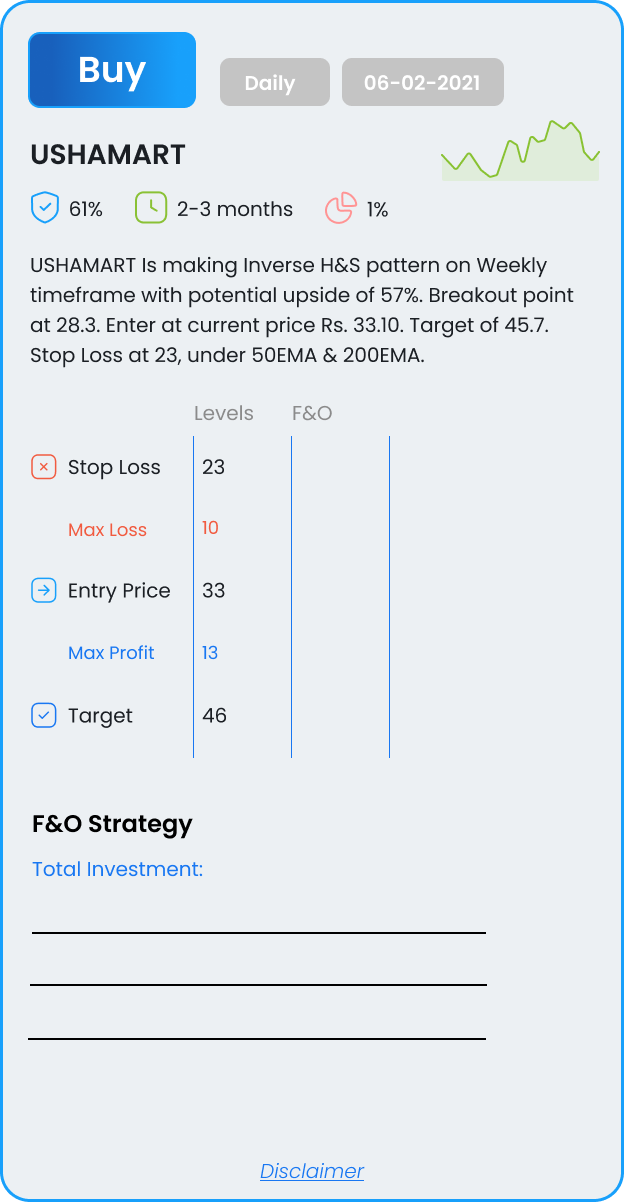
Is making an Inverse H&S pattern on a Weekly timeframe with a potential upside of 57%. Breakout point at 28.3. Enter at the current price Rs. 33.10. Target of 45.7. Stop Loss at 23, under 50EMA & 200EMA.