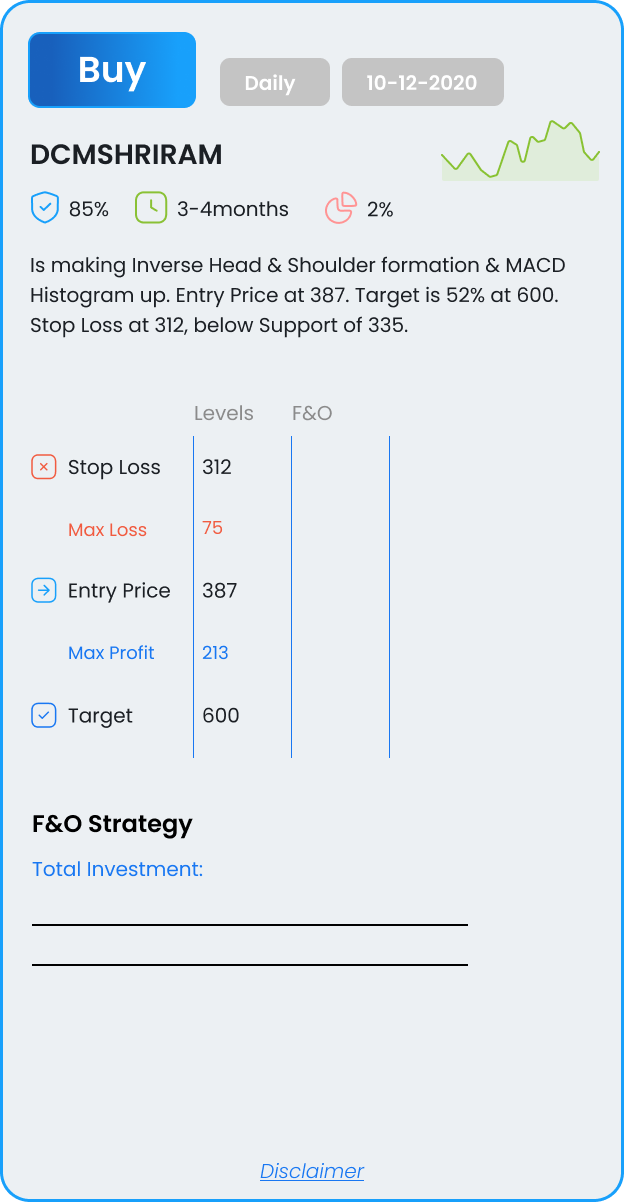
DCMSHRIRAM
Is making Inverse Head & Shoulder formation & MACD Histogram up. Entry Price at 387. Target is 52% at 600. Stop Loss at 312, below Support of 335.

Is making Inverse Head & Shoulder formation & MACD Histogram up. Entry Price at 387. Target is 52% at 600. Stop Loss at 312, below Support of 335.
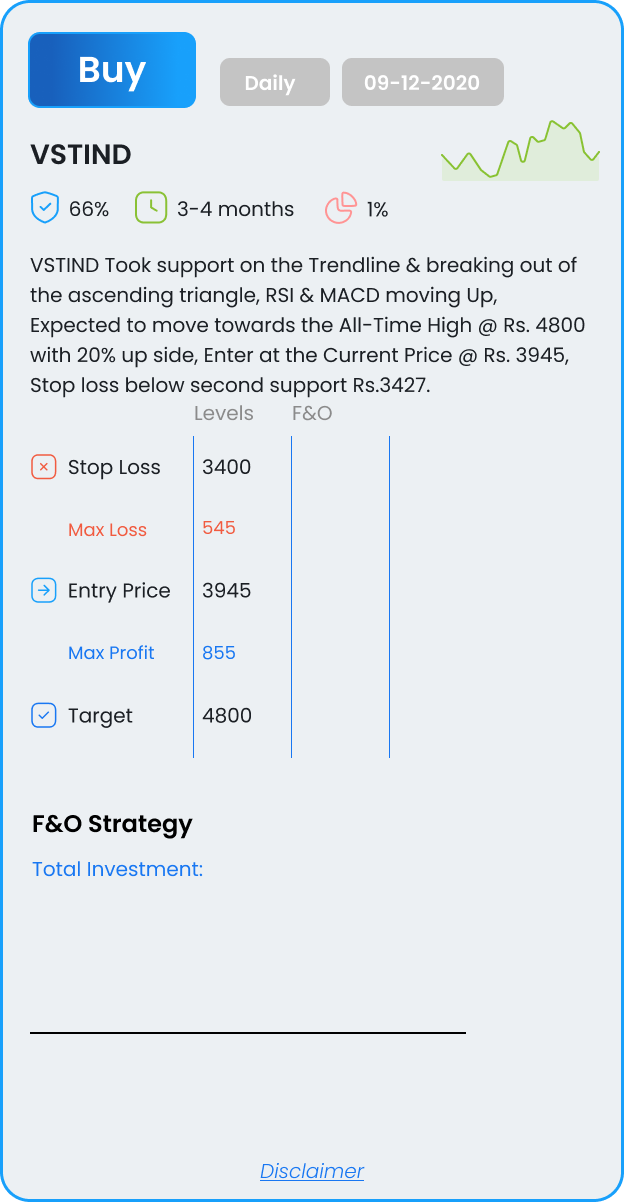
Took support on the Trendline & breaking out of the ascending triangle, RSI & MACD moving Up, Expected to move towards the All-Time High @ Rs. 4800 with 20% up side, Enter at the Current Price @ Rs. 3945, Stop loss below second support Rs.3427.
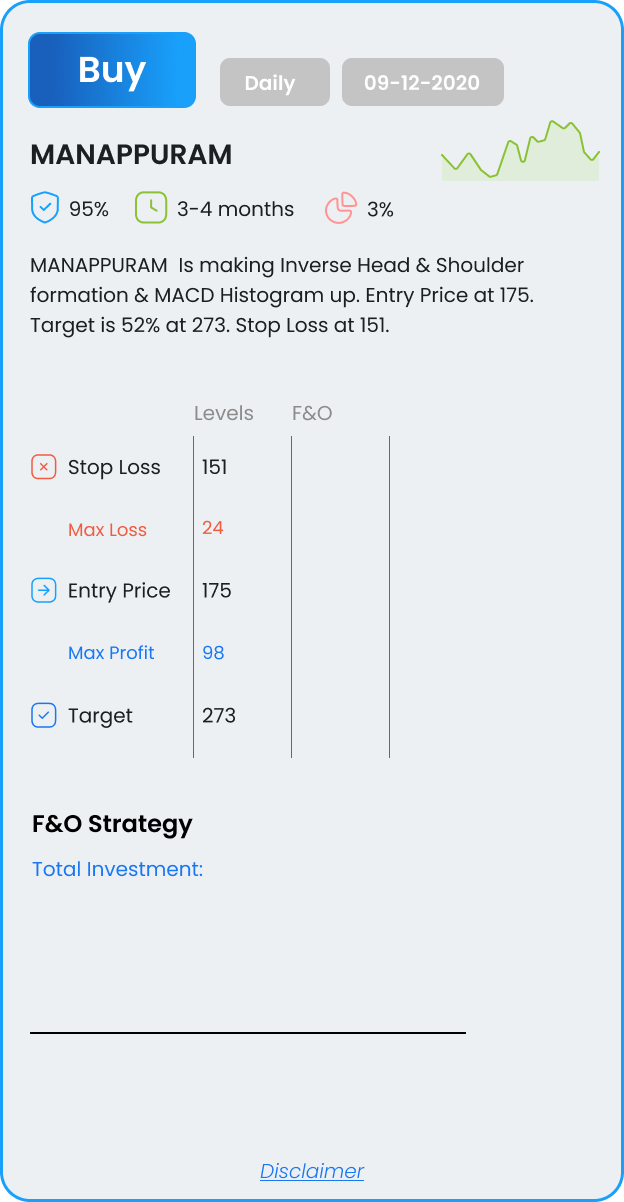
Is making Inverse Head & Shoulder formation & MACD Histogram up. Entry Price at 175. Target is 52% at 273. Stop Loss at 151.
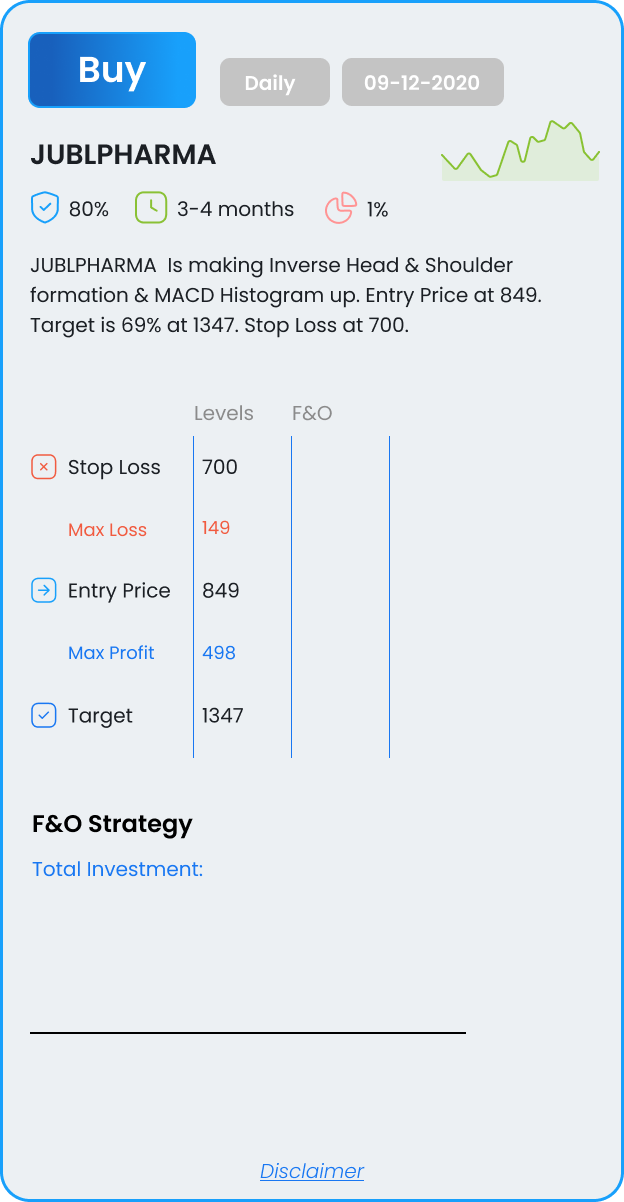
Is making Inverse Head & Shoulder formation & MACD Histogram up. Entry Price at 849. Target is 69% at 1347. Stop Loss at 700.
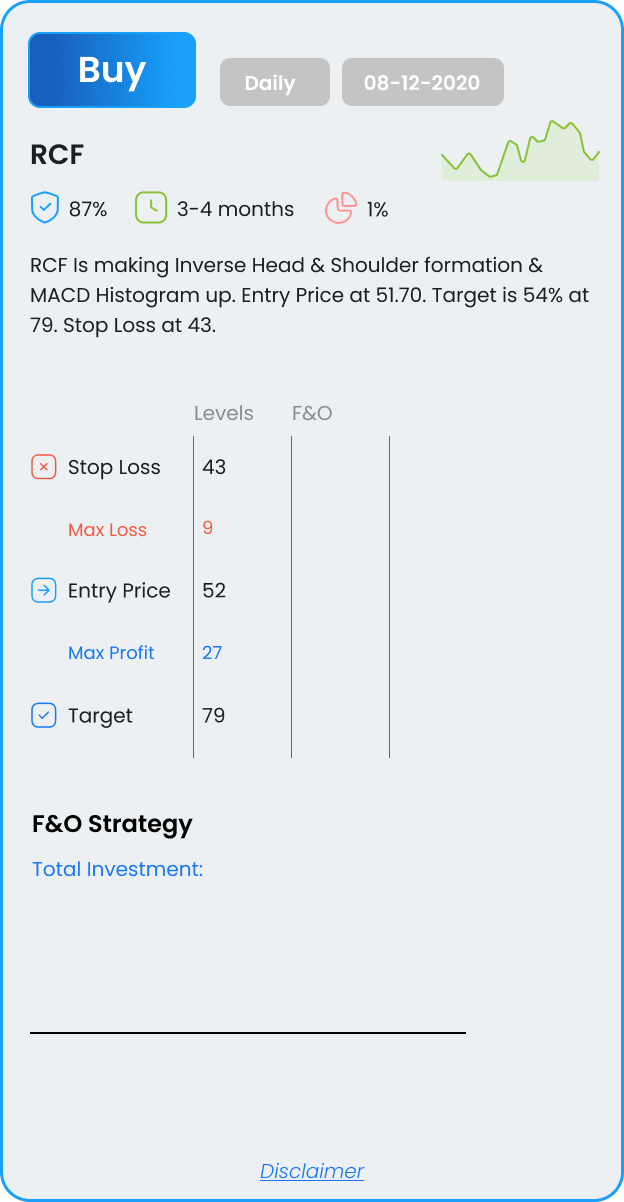
Is making Inverse Head & Shoulder formation & MACD Histogram up. Entry Price at 51.70. Target is 54% at 79. Stop Loss at 43.
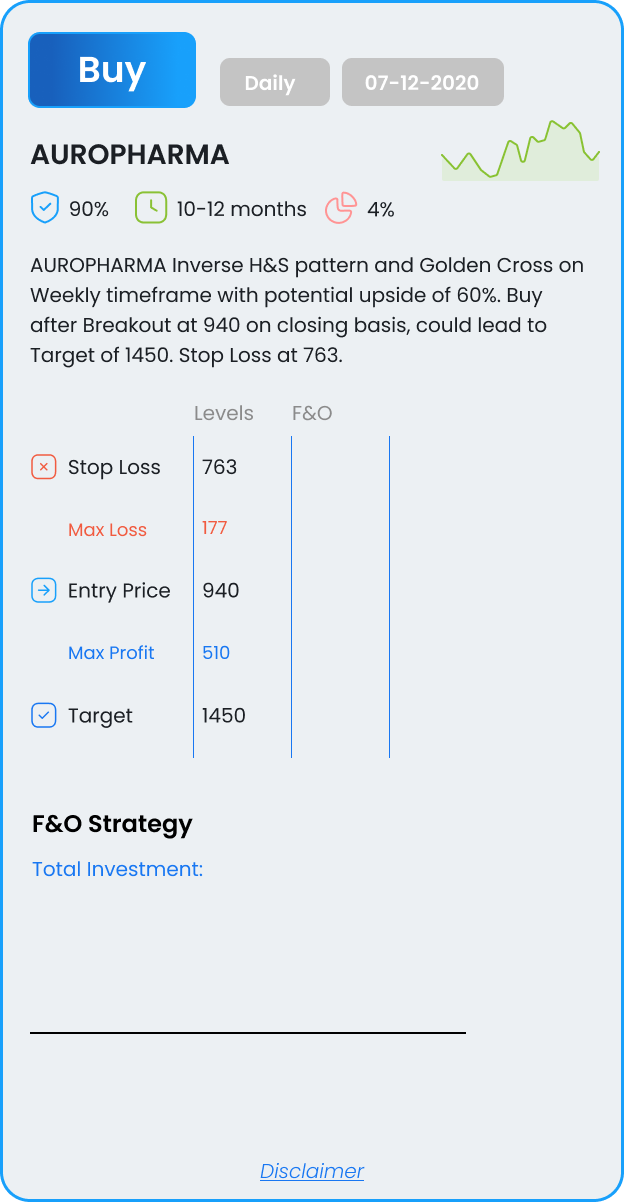
Inverse H&S pattern and Golden Cross on Weekly timeframe with potential upside of 60%. Buy after Breakout at 940 on closing basis, could lead to Target of 1450. Stop Loss at 763.
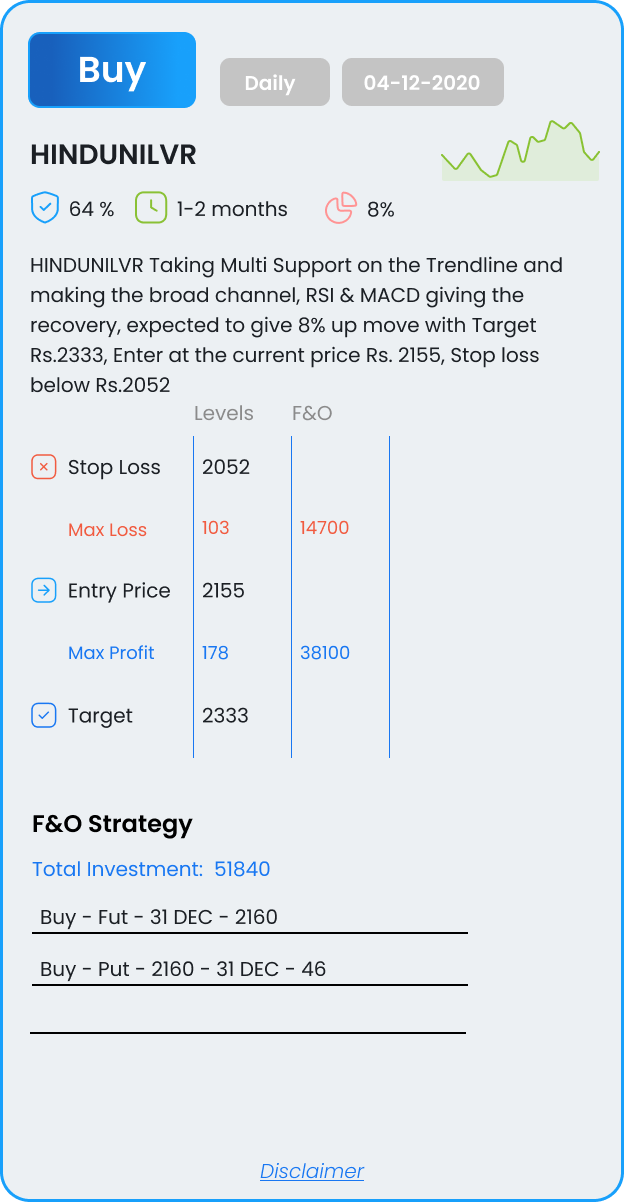
Taking Multi Support on the Trendline and making the broad channel, RSI & MACD giving the recovery, expected to give 8% up move with Target Rs.2333, Enter at the current price Rs. 2155, Stop loss below Rs.2052
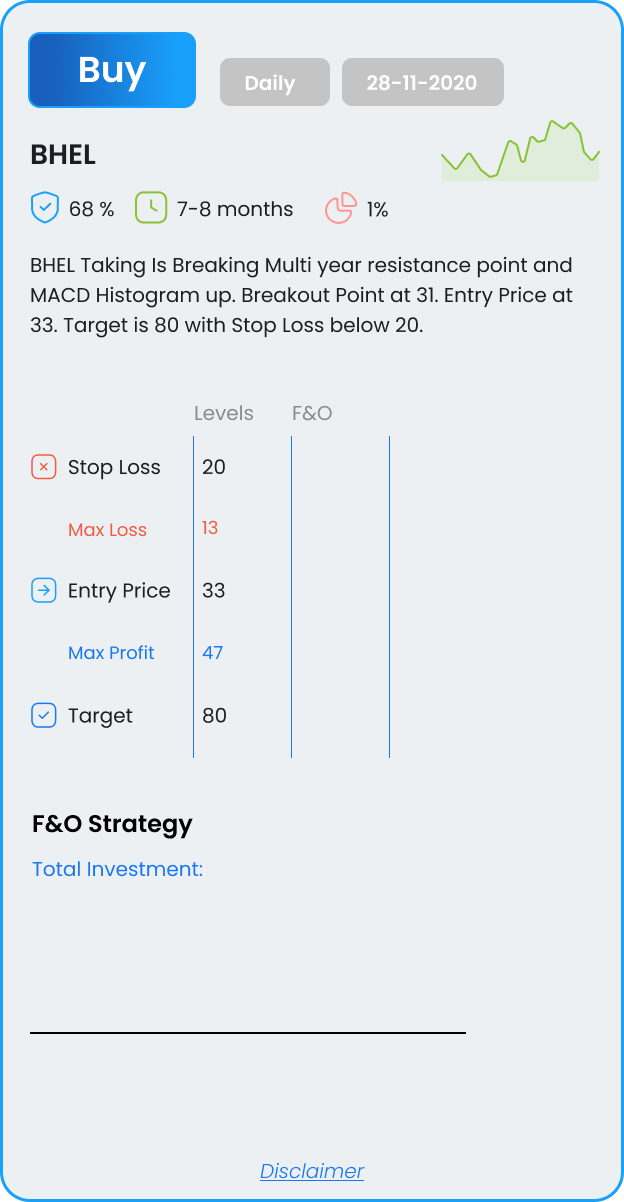
Is Breaking Multi year resistance point and MACD Histogram up. Breakout Point at 31. Entry Price at 33. Target is 80 with Stop Loss below 20.
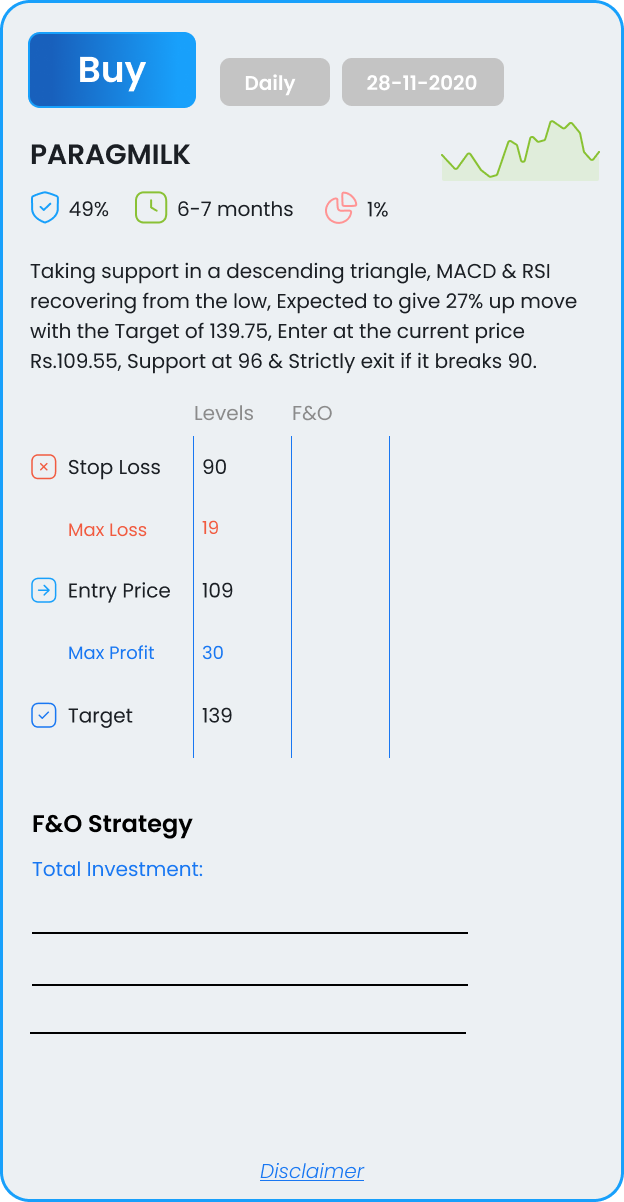
Taking support in a descending triangle, MACD & RSI recovering from the low, Expected to give 27% up move with the Target of 139.75, Enter at the current price Rs.109.55, Support at 96 & Strictly exit if it breaks 90.
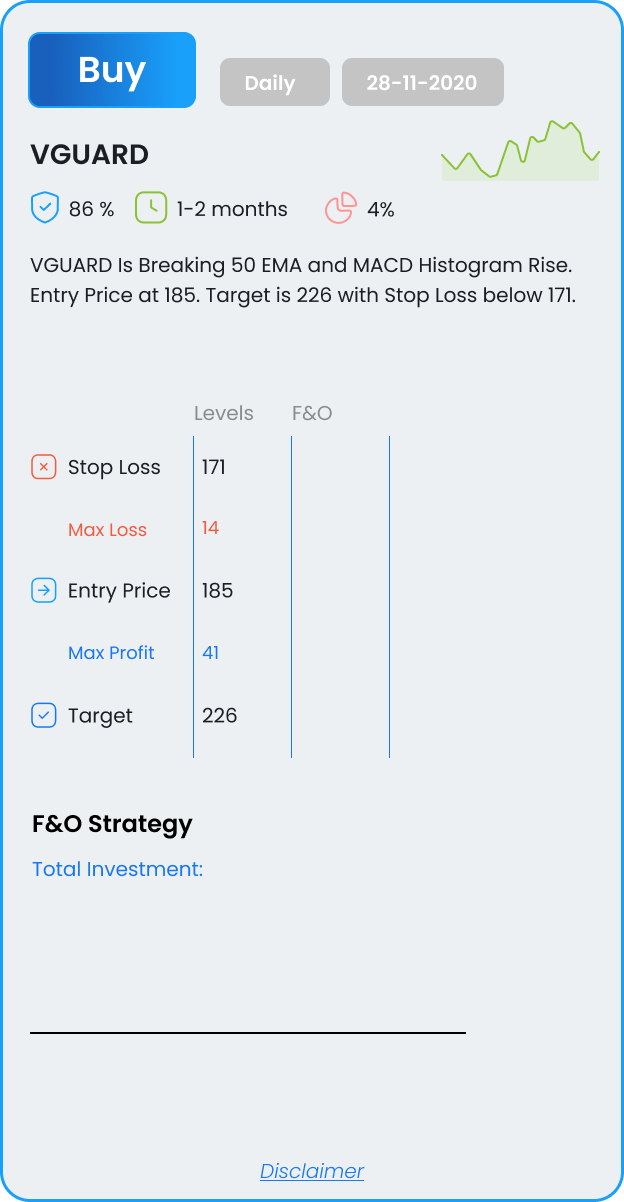
Is Breaking 50 EMA and MACD Histogram Rise. Entry Price at 185. Target is 226 with Stop Loss below 171.