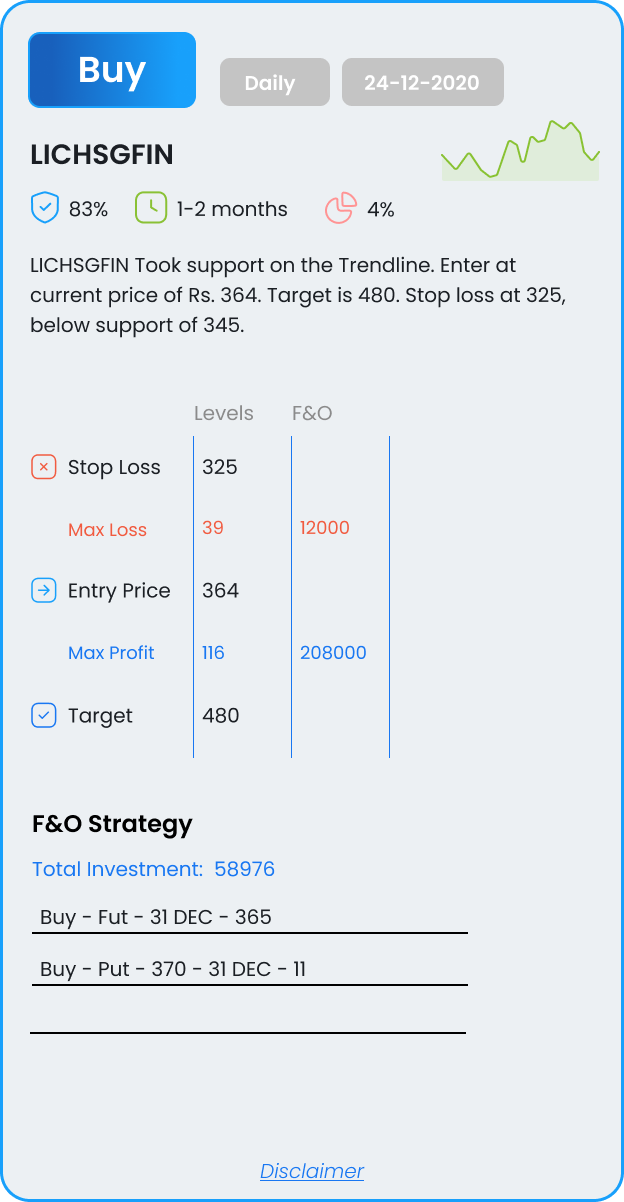
LICHSGFIN
Took support on the Trendline. Enter at current price of Rs. 364. Target is 480. Stop loss at 325, below support of 345.

Took support on the Trendline. Enter at current price of Rs. 364. Target is 480. Stop loss at 325, below support of 345.
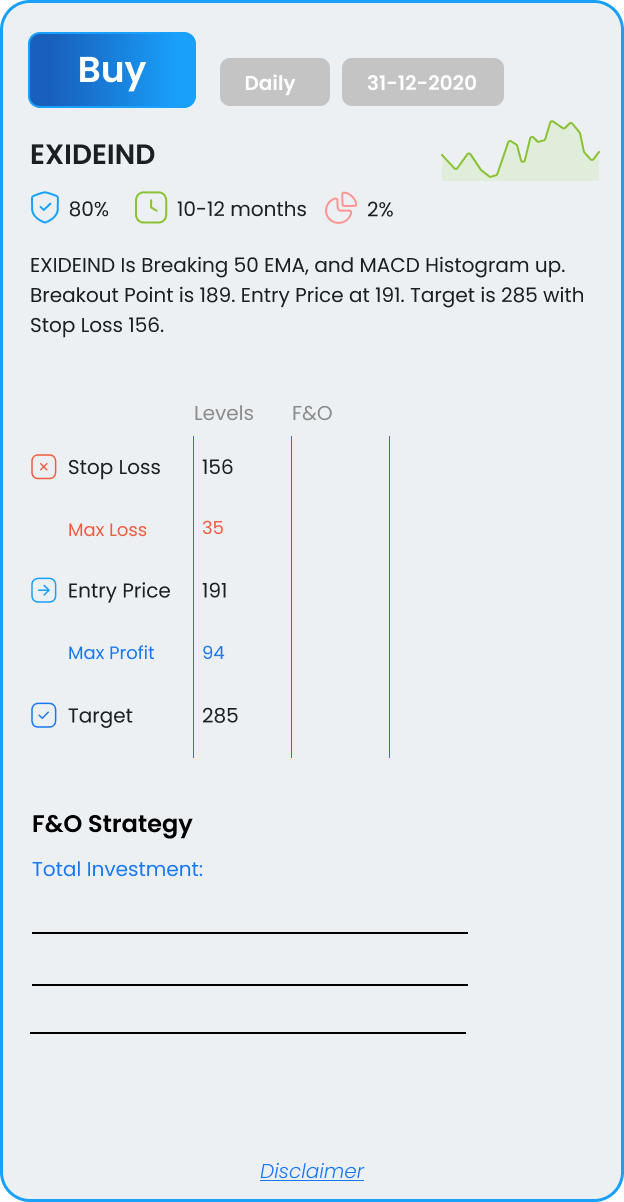
Is Breaking 50 EMA, and MACD Histogram up. Breakout Point is 189. Entry Price at 191. Target is 285 with Stop Loss 156.
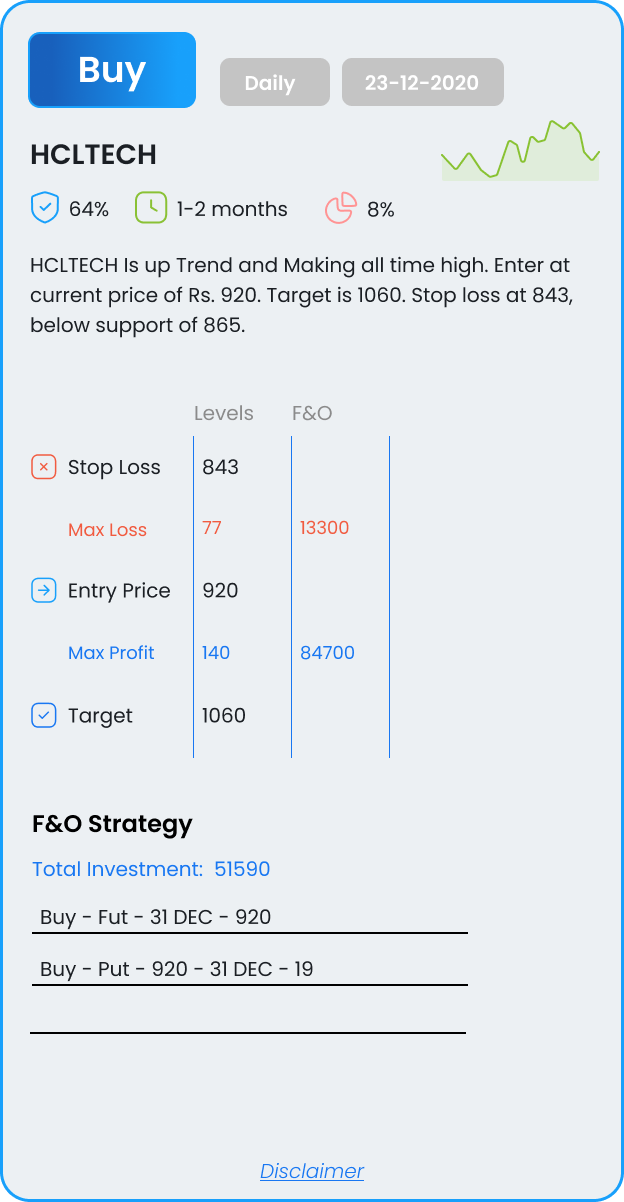
Is up Trend and Making all time high. Enter at current price of Rs. 920. Target is 1060. Stop loss at 843, below support of 865.
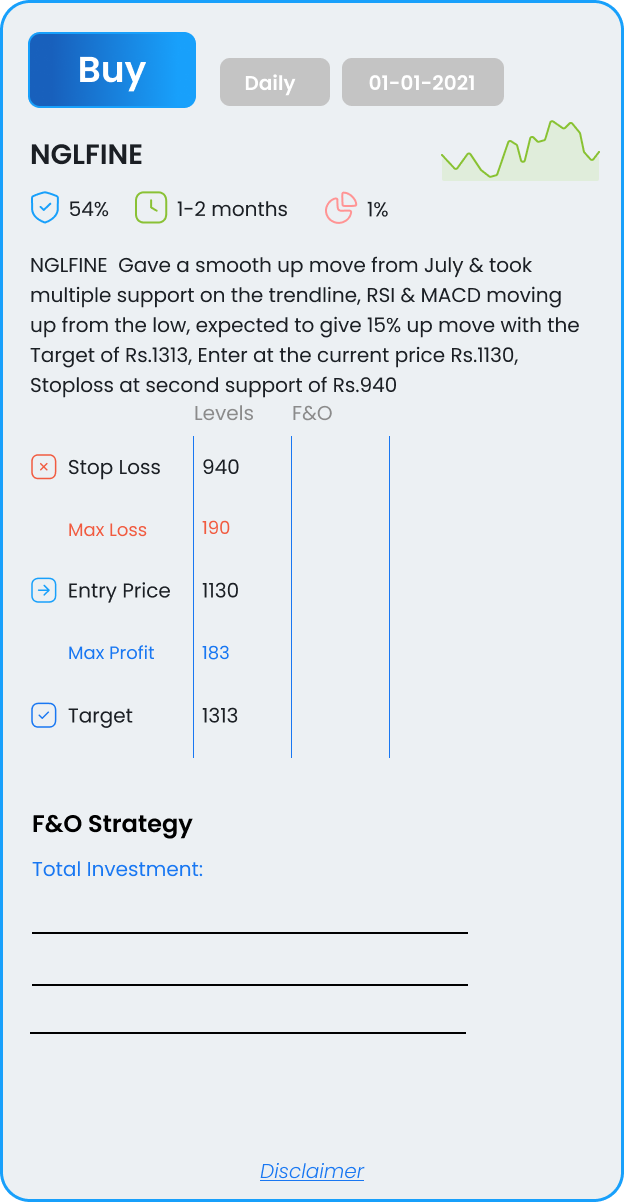
Gave a smooth up move from July & took multiple support on the trendline, RSI & MACD moving up from the low, expected to give 15% up move with the Target of Rs.1313, Enter at the current price Rs.1130, Stoploss at second support of Rs.940
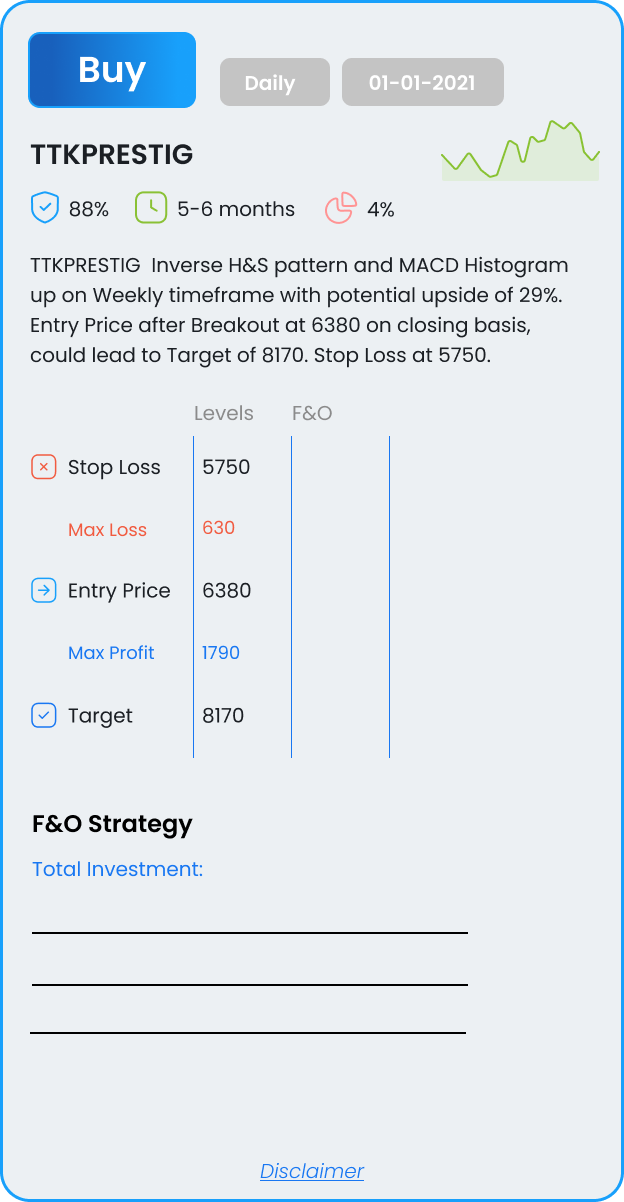
Inverse H&S pattern and MACD Histogram up on Weekly timeframe with potential upside of 29%. Entry Price after Breakout at 6380 on a closing basis, could lead to a Target of 8170. Stop Loss at 5750.
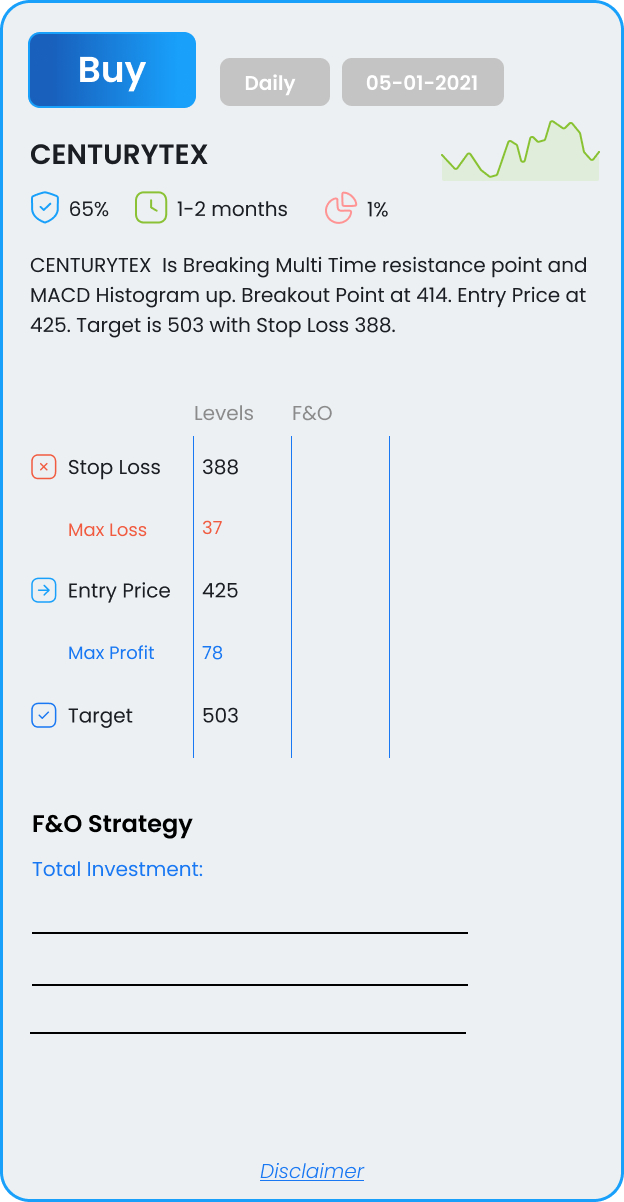
Is Breaking Multi Time resistance point and MACD Histogram up. Breakout Point at 414. Entry Price at 425. Target is 503 with Stop Loss 388.
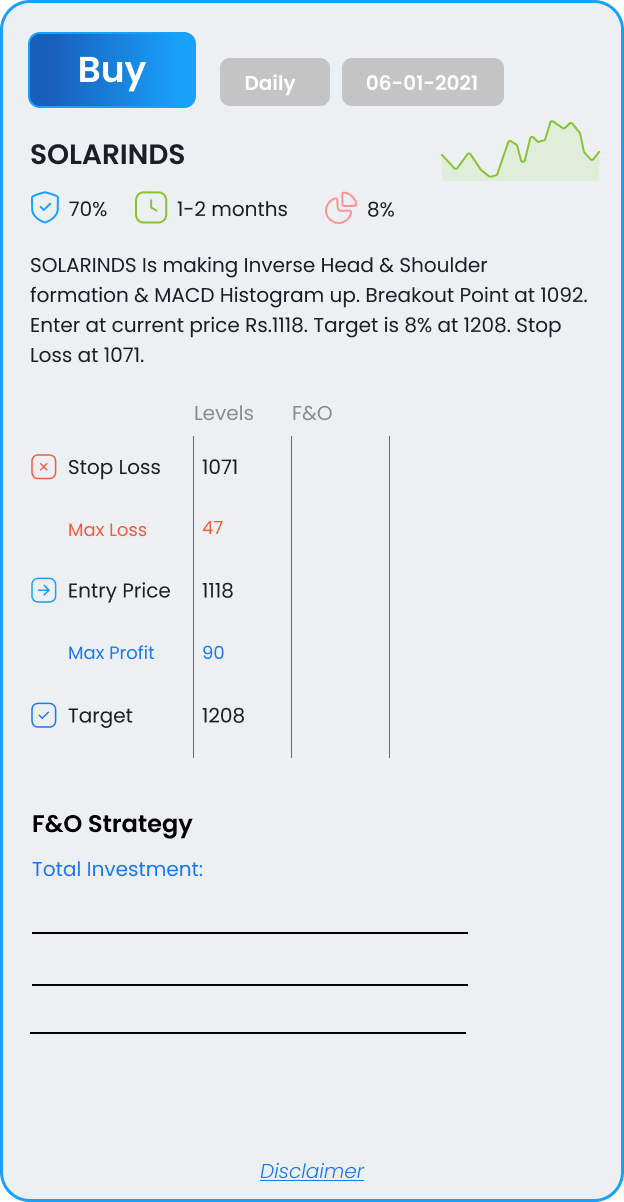
Is making Inverse Head & Shoulder formation & MACD Histogram up. Breakout Point at 1092. Enter at the current price of Rs.1118. Target is 8% at 1208. Stop Loss at 1071.
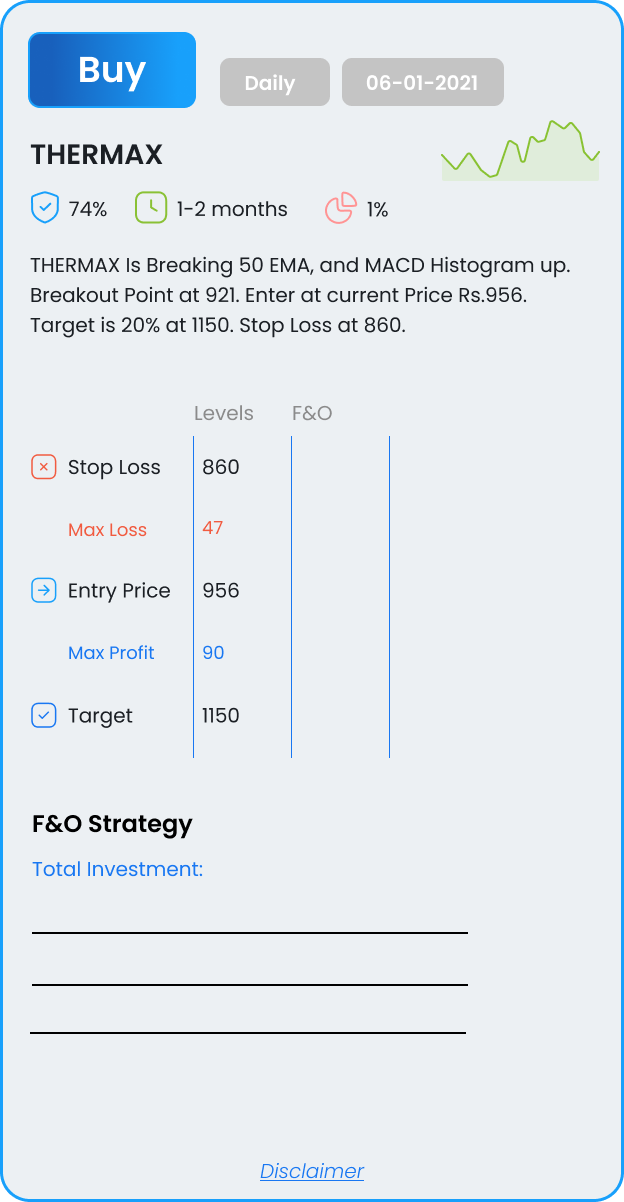
Is Breaking 50 EMA, and MACD Histogram up. Breakout Point at 921. Enter at current Price Rs.956. Target is 20% at 1150. Stop Loss at 860.
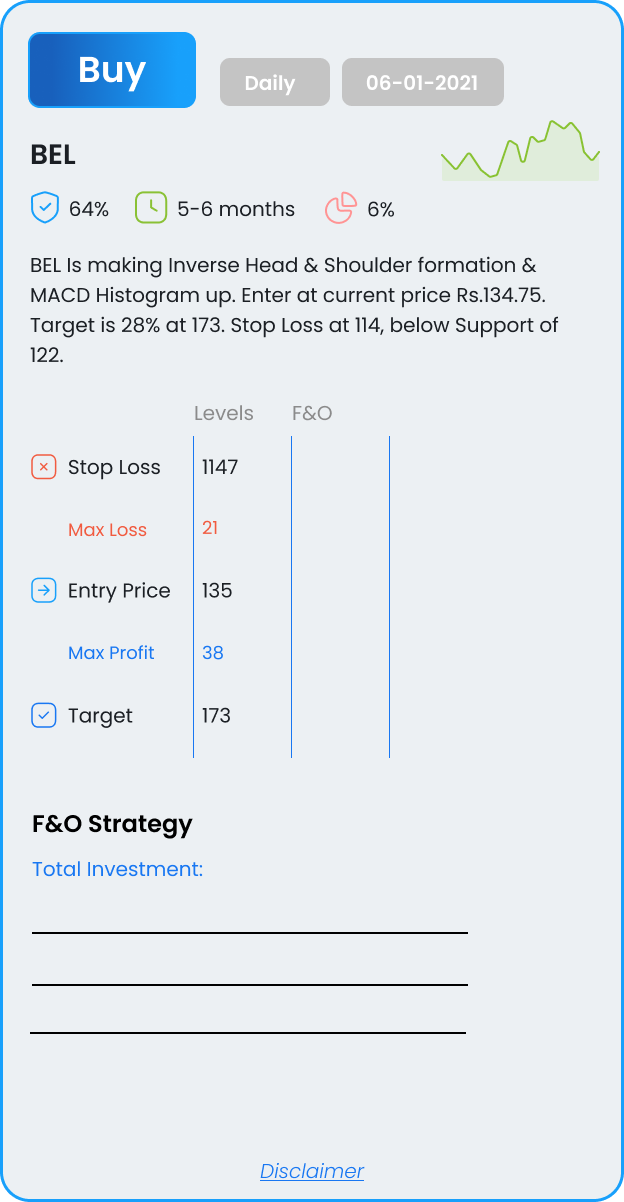
Is making Inverse Head & Shoulder formation & MACD Histogram up. Enter at current price Rs.134.75. Target is 28% at 173. Stop Loss at 114, below Support of 122.
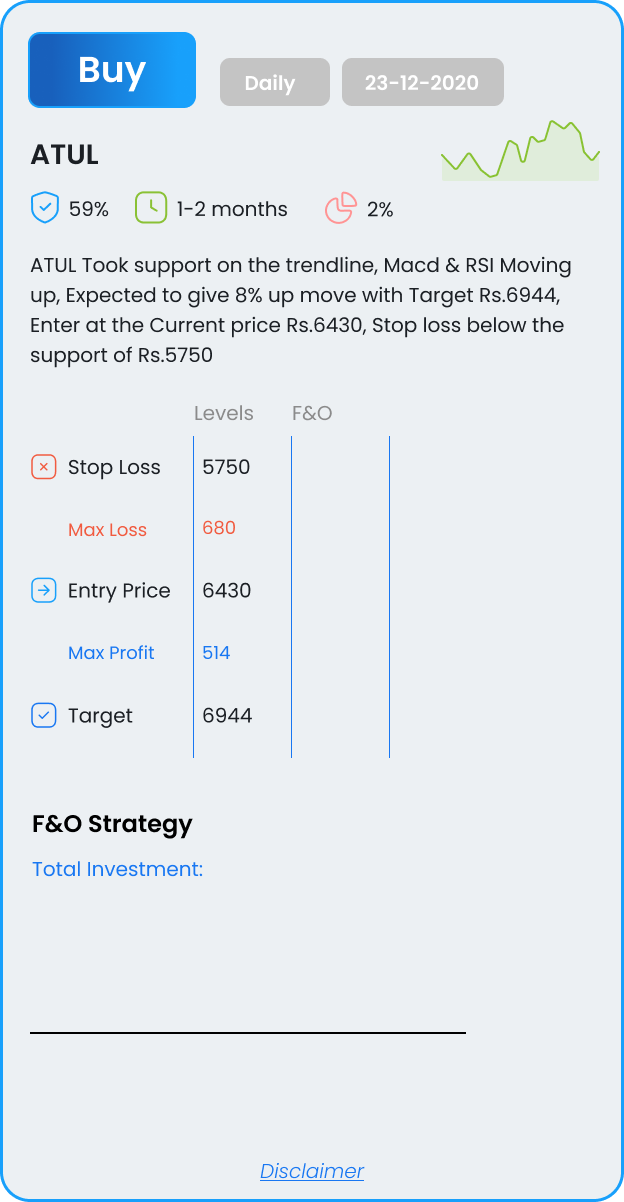
Took support on the trendline, Macd & RSI Moving up, Expected to give 8% up move with Target Rs.6944, Enter at the Current price Rs.6430, Stop loss below the support of Rs.5750