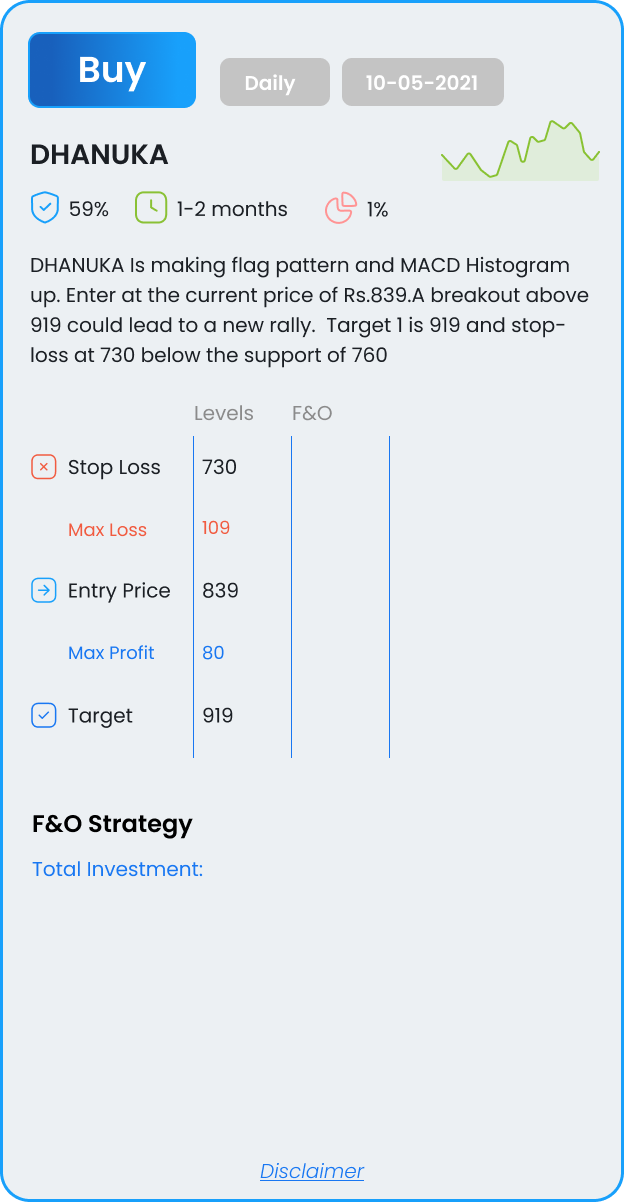
DHANUKA
Is making flag pattern and MACD Histogram up. Enter at the current price of Rs.839.A breakout above 919 could lead to a new rally. Target 1 is 919 and stop-loss at 730 below the support of 760

Is making flag pattern and MACD Histogram up. Enter at the current price of Rs.839.A breakout above 919 could lead to a new rally. Target 1 is 919 and stop-loss at 730 below the support of 760
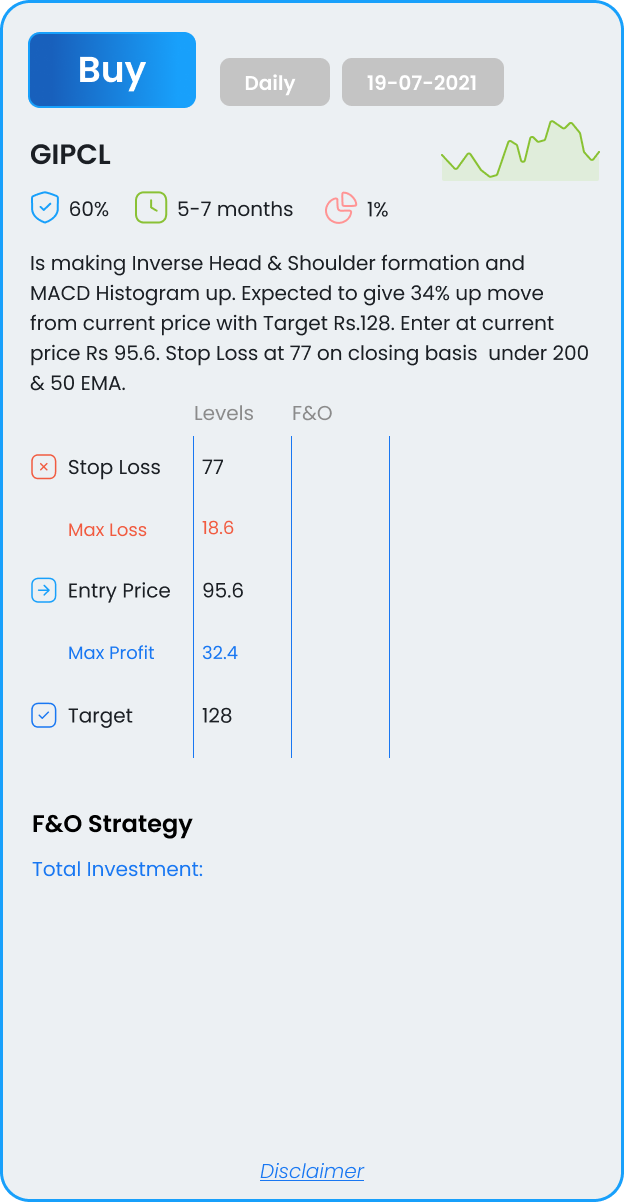
Is making Inverse Head & Shoulder formation and MACD Histogram up. Expected to give 34% up move from current price with Target Rs.128. Enter at current price Rs 95.6. Stop Loss at 77 on closing basis under 200 & 50 EMA.
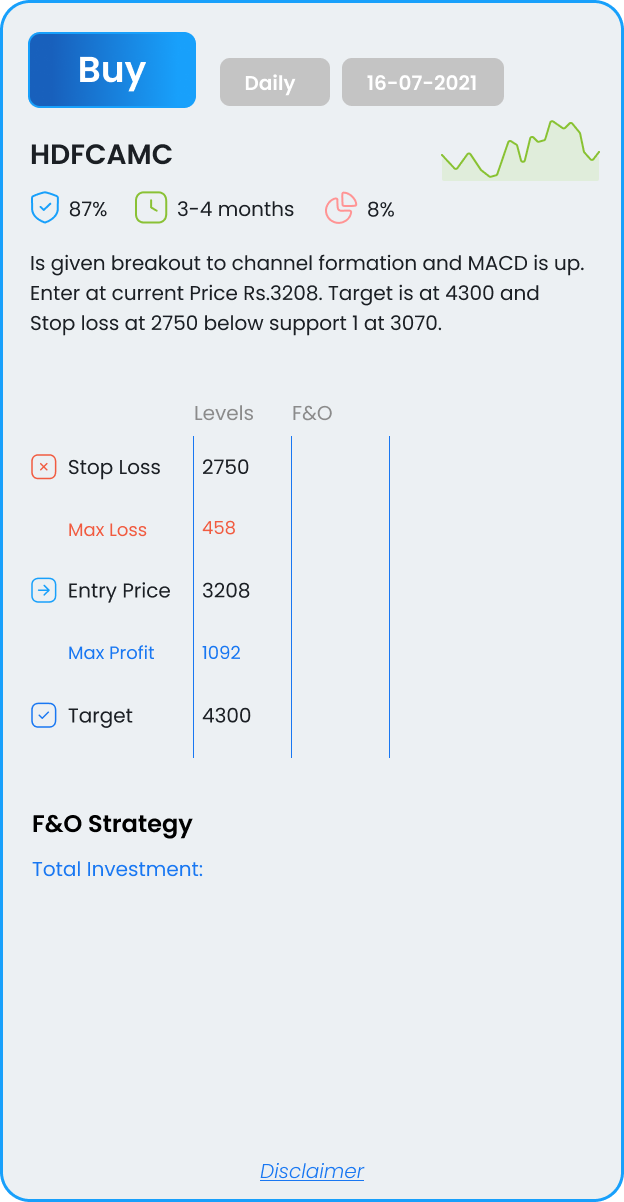
Is given breakout to channel formation and MACD is up. Enter at current Price Rs.3208. Target is at 4300 and Stop loss at 2750 below support 1 at 3070.
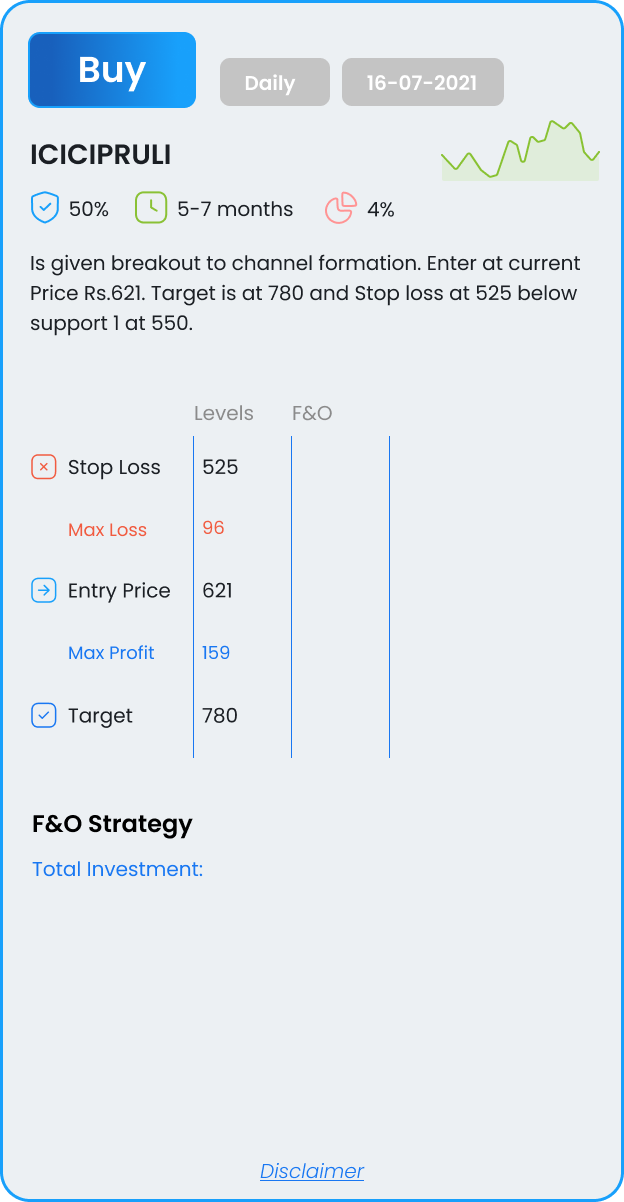
Is given breakout to channel formation. Enter at current Price Rs.621. Target is at 780 and Stop loss at 525 below support 1 at 550.
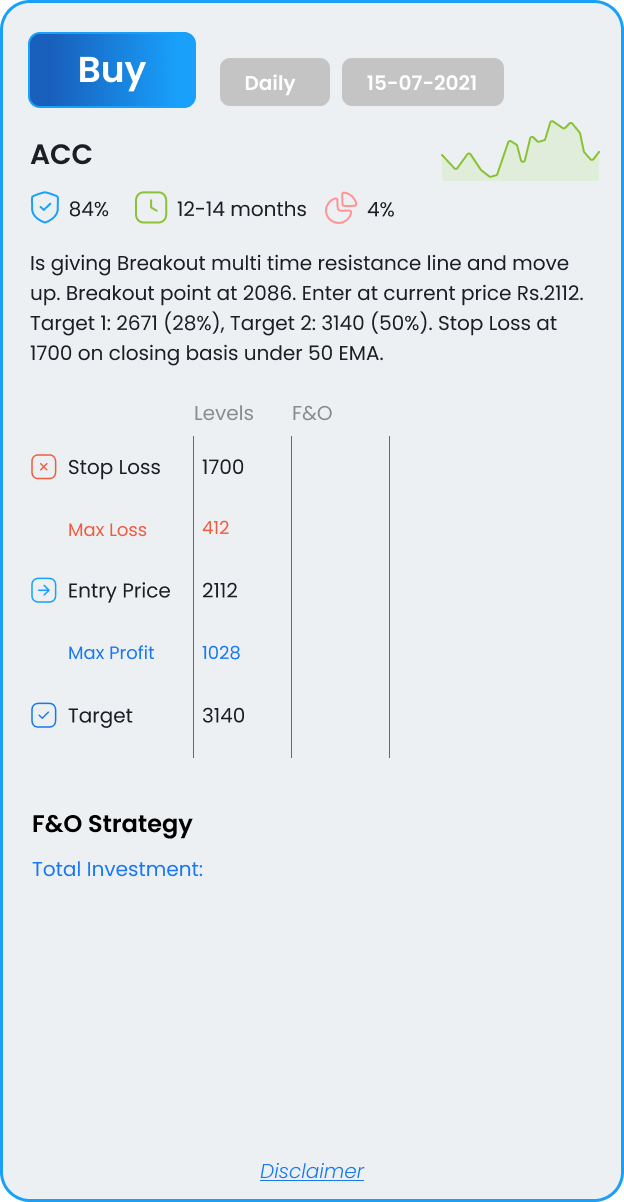
Is giving Breakout multi time resistance line and move up. Breakout point at 2086. Enter at current price Rs.2112. Target 1: 2671 (28%), Target 2: 3140 (50%). Stop Loss at 1700 on closing basis under 50 EMA.
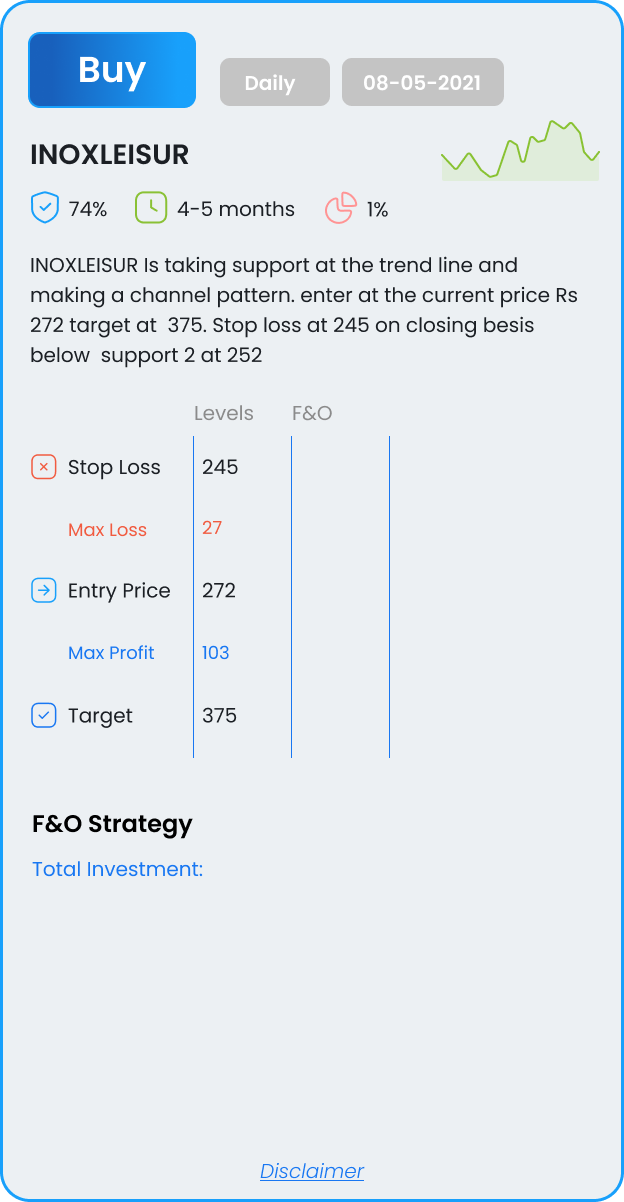
Is taking support at the trend line and making a channel pattern. enter at the current price Rs 272 target at 375. Stop loss at 245 on closing besis below support 2 at 252
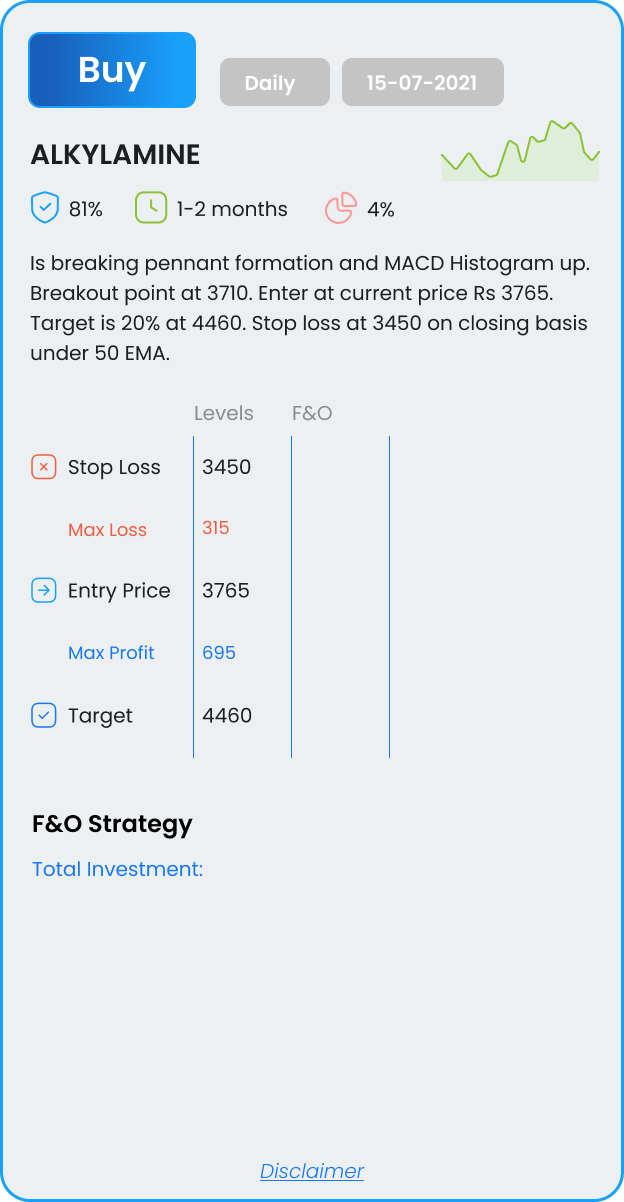
Is breaking pennant formation and MACD Histogram up. Breakout point at 3710. Enter at current price Rs 3765. Target is 20% at 4460. Stop loss at 3450 on closing basis under 50 EMA.
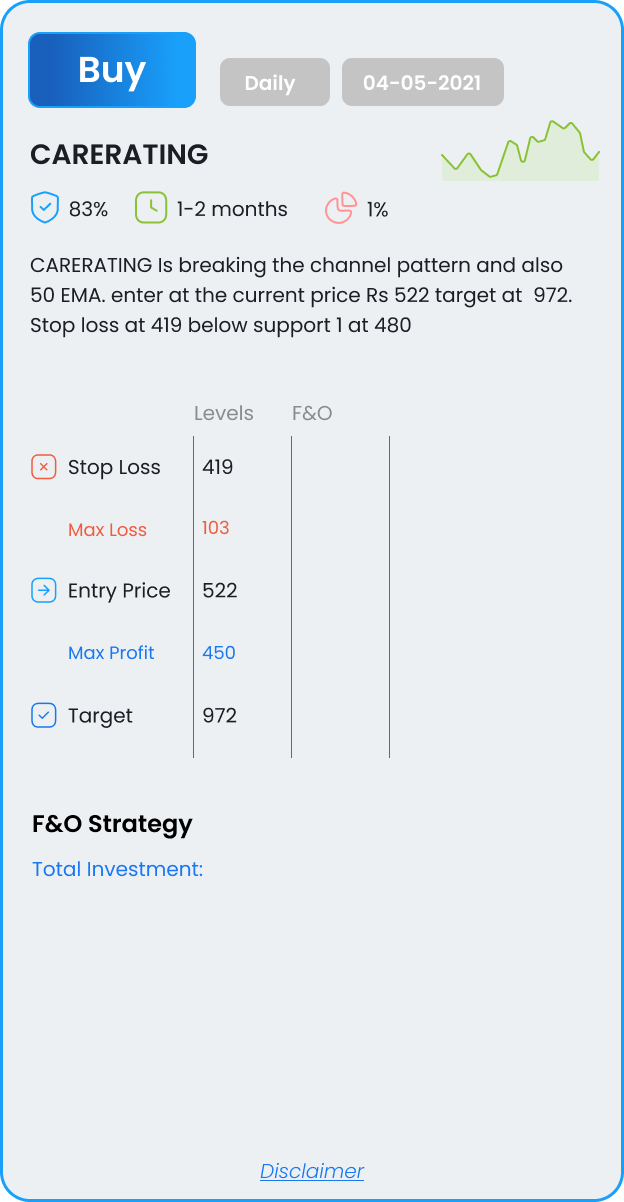
CARERATING Is breaking the channel pattern and also 50 EMA. enter at the current price Rs 522 target at 972. Stop loss at 419 below support 1 at 480
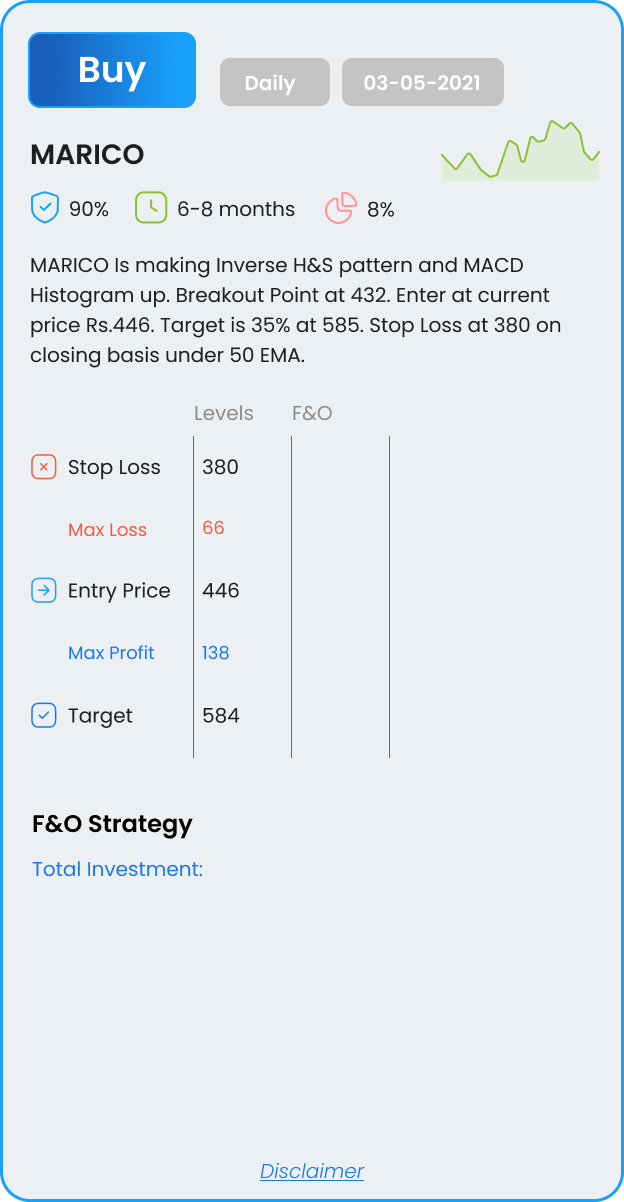
Is making Inverse H&S pattern and MACD Histogram up. Breakout Point at 432. Enter at current price Rs.446. Target is 35% at 585. Stop Loss at 380 on closing basis under 50 EMA.
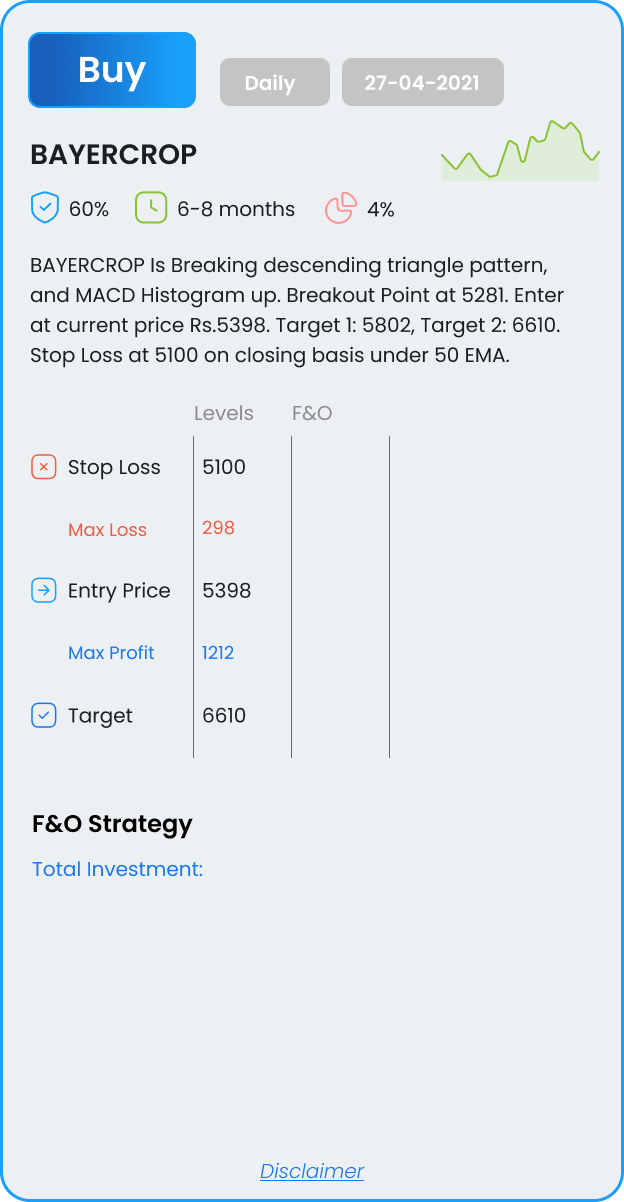
Is Breaking descending triangle pattern, and MACD Histogram up. Breakout Point at 5281. Enter at current price Rs.5398. Target 1: 5802, Target 2: 6610. Stop Loss at 5100 on closing basis under 50 EMA.