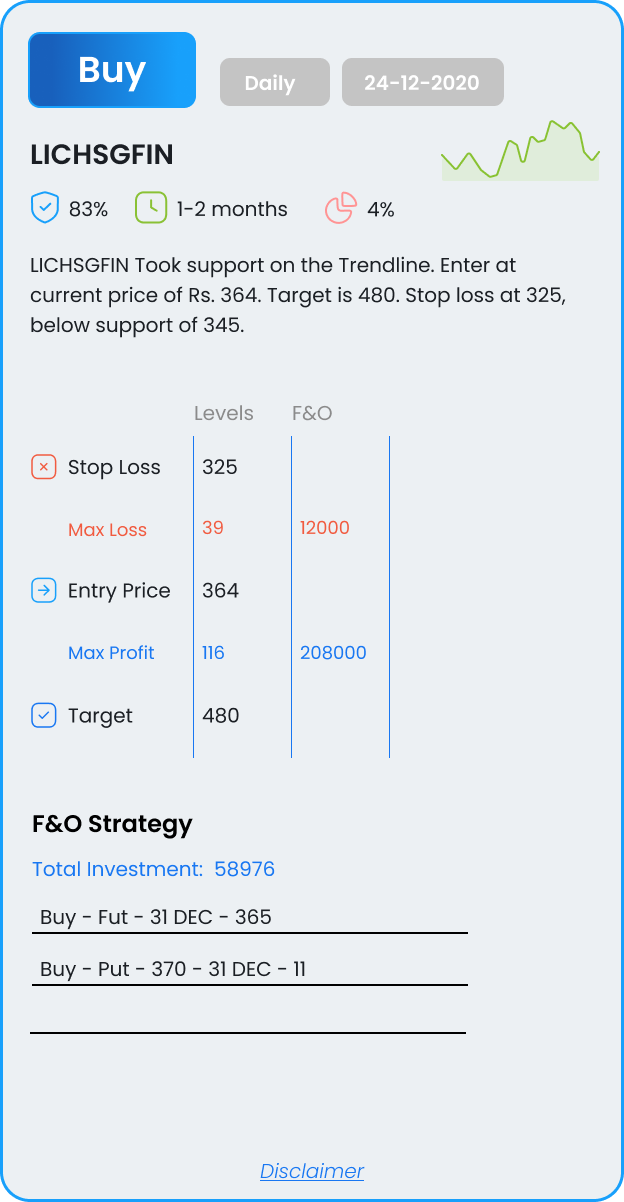
LICHSGFIN
Took support on the Trendline. Enter at current price of Rs. 364. Target is 480. Stop loss at 325, below support of 345.

Took support on the Trendline. Enter at current price of Rs. 364. Target is 480. Stop loss at 325, below support of 345.
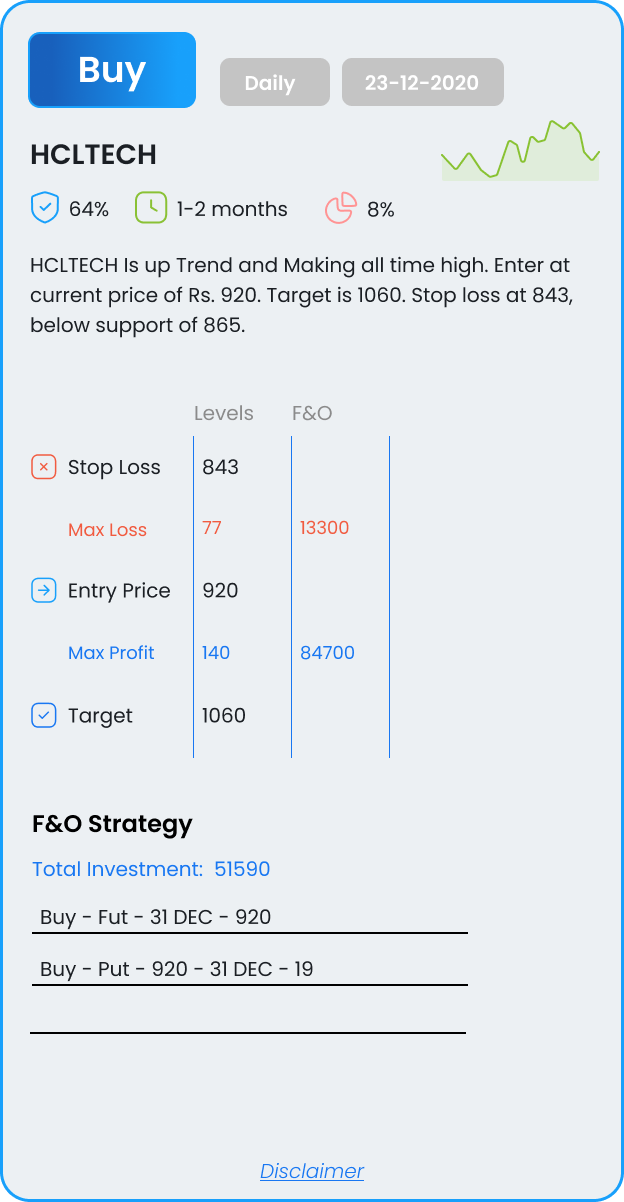
Is up Trend and Making all time high. Enter at current price of Rs. 920. Target is 1060. Stop loss at 843, below support of 865.
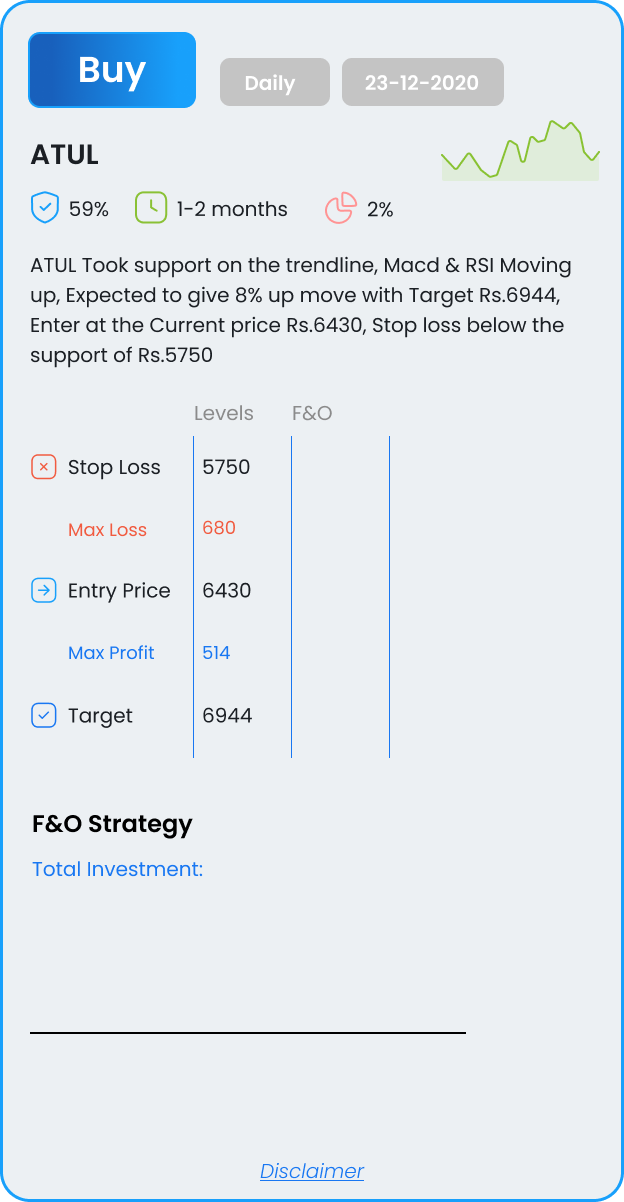
Took support on the trendline, Macd & RSI Moving up, Expected to give 8% up move with Target Rs.6944, Enter at the Current price Rs.6430, Stop loss below the support of Rs.5750
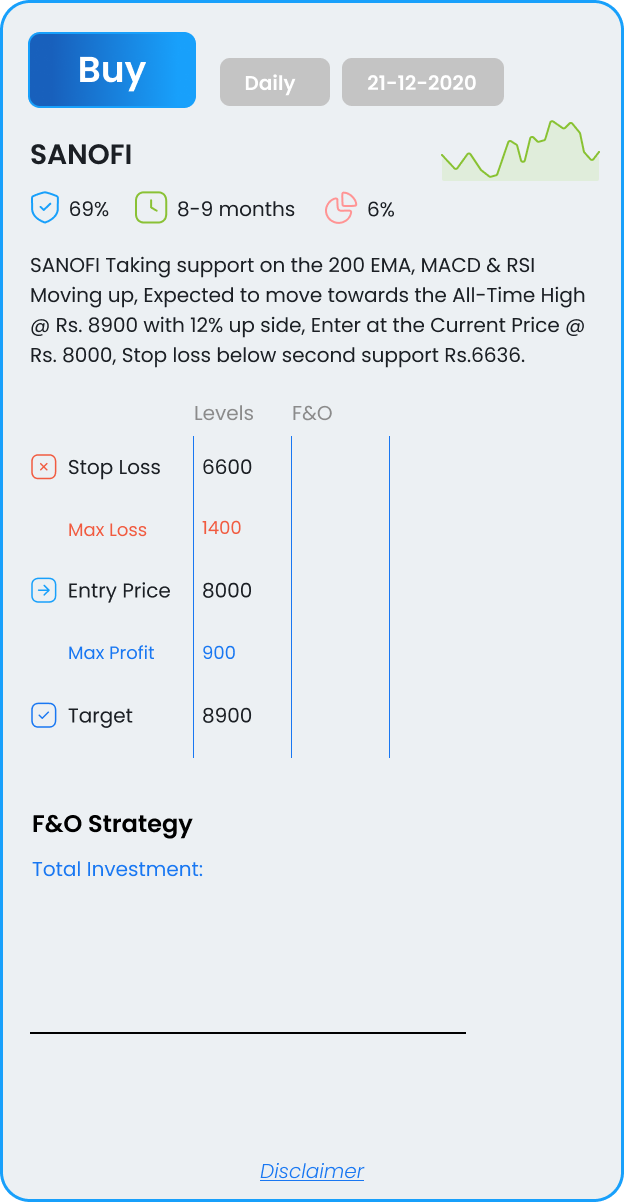
Taking support on the 200 EMA, MACD & RSI Moving up, Expected to move towards the All-Time High @ Rs. 8900 with 12% up side, Enter at the Current Price @ Rs. 8000, Stop loss below second support Rs.6636.
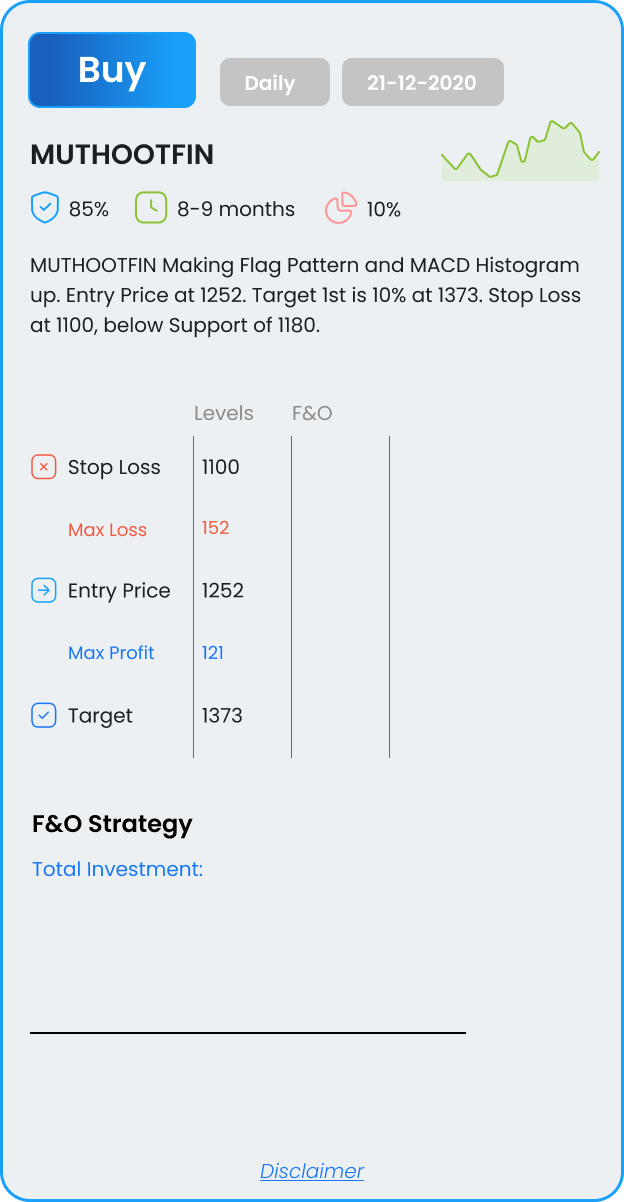
Making Flag Pattern and MACD Histogram up. Entry Price at 1252. Target 1st is 10% at 1373. Stop Loss at 1100, below Support of 1180.
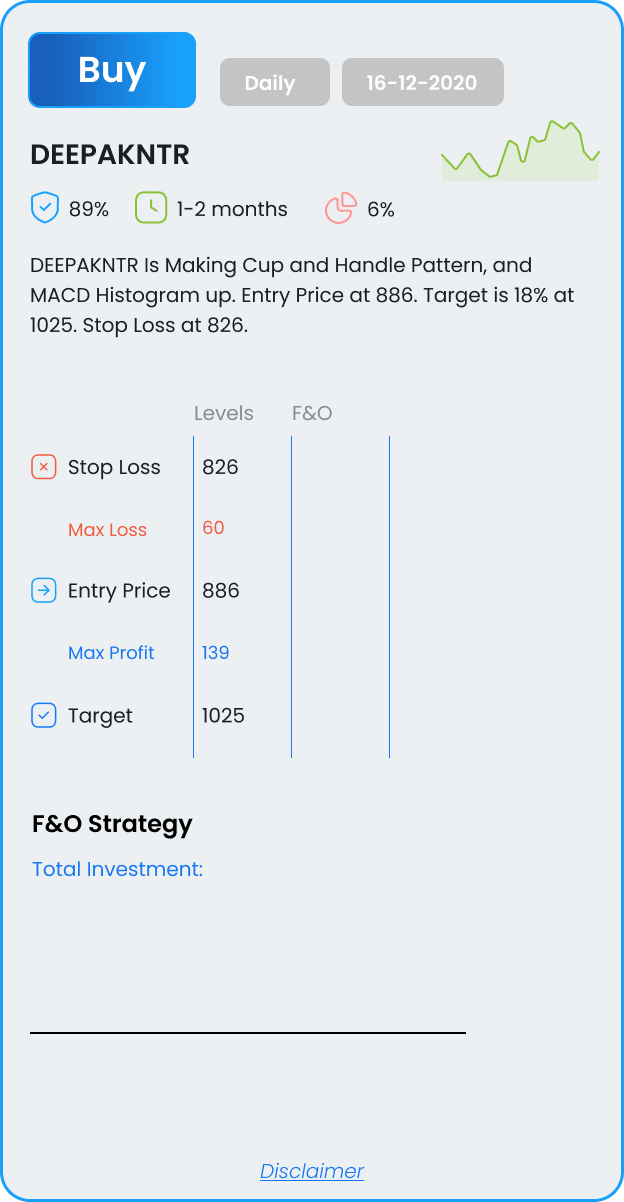
Is Making Cup and Handle Pattern, and MACD Histogram up. Entry Price at 886. Target is 18% at 1025. Stop Loss at 826.
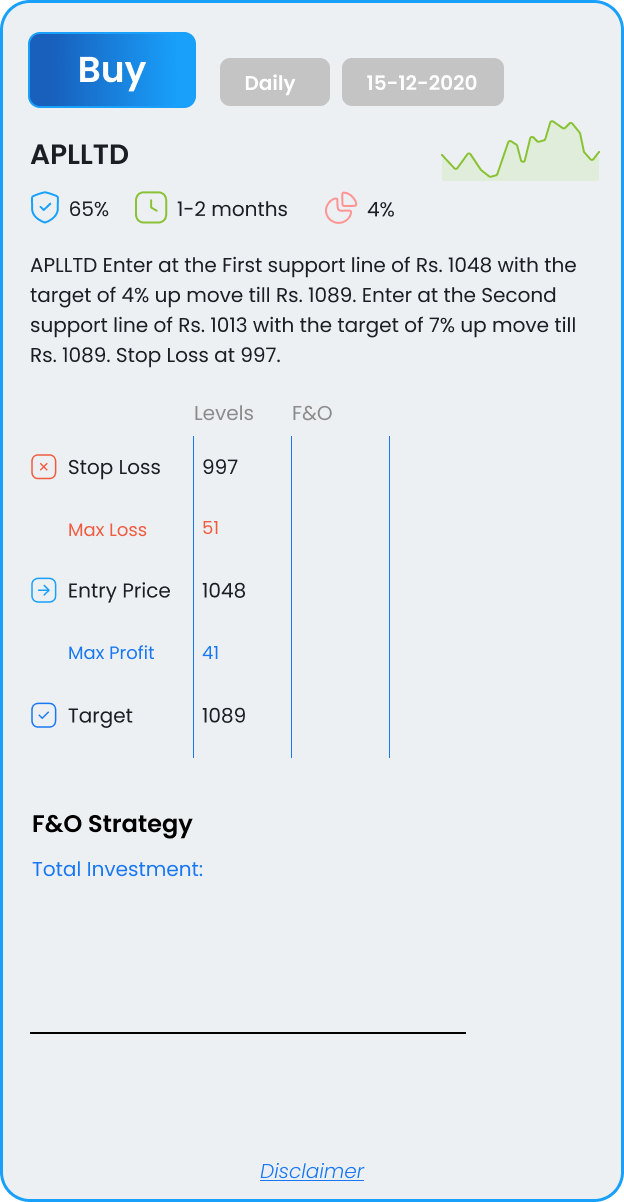
Enter at the First support line of Rs. 1048 with the target of 4% up move till Rs. 1089. Enter at the Second support line of Rs. 1013 with the target of 7% up move till Rs. 1089. Stop Loss at 997.
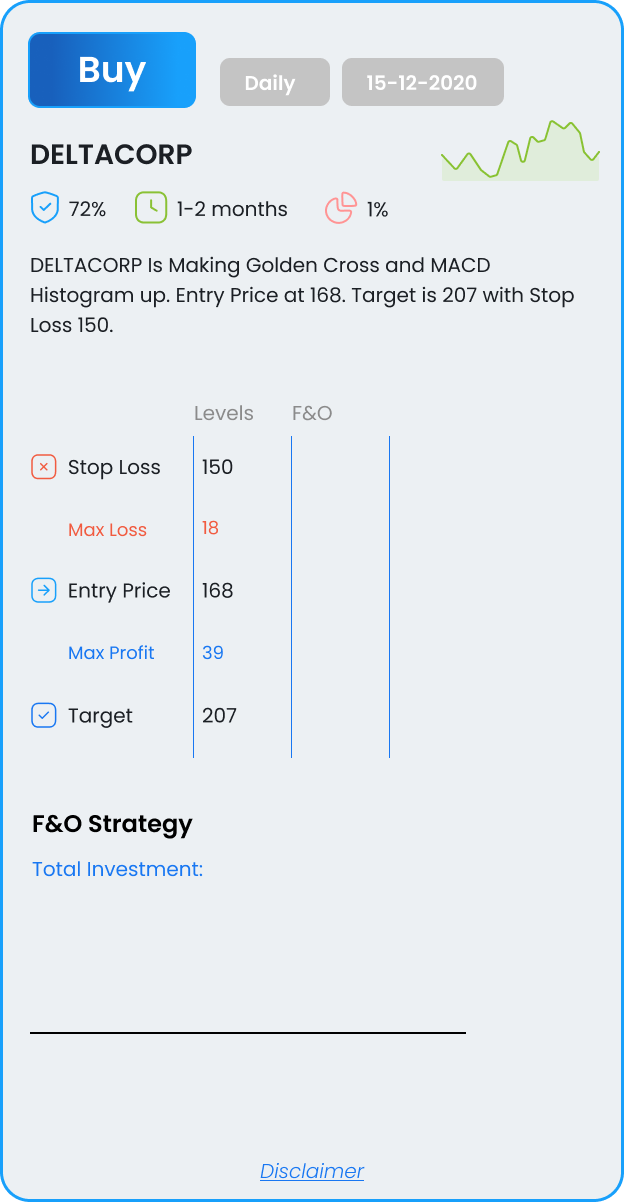
Is Making Golden Cross and MACD Histogram up. Entry Price at 168. Target is 207 with Stop Loss 150.
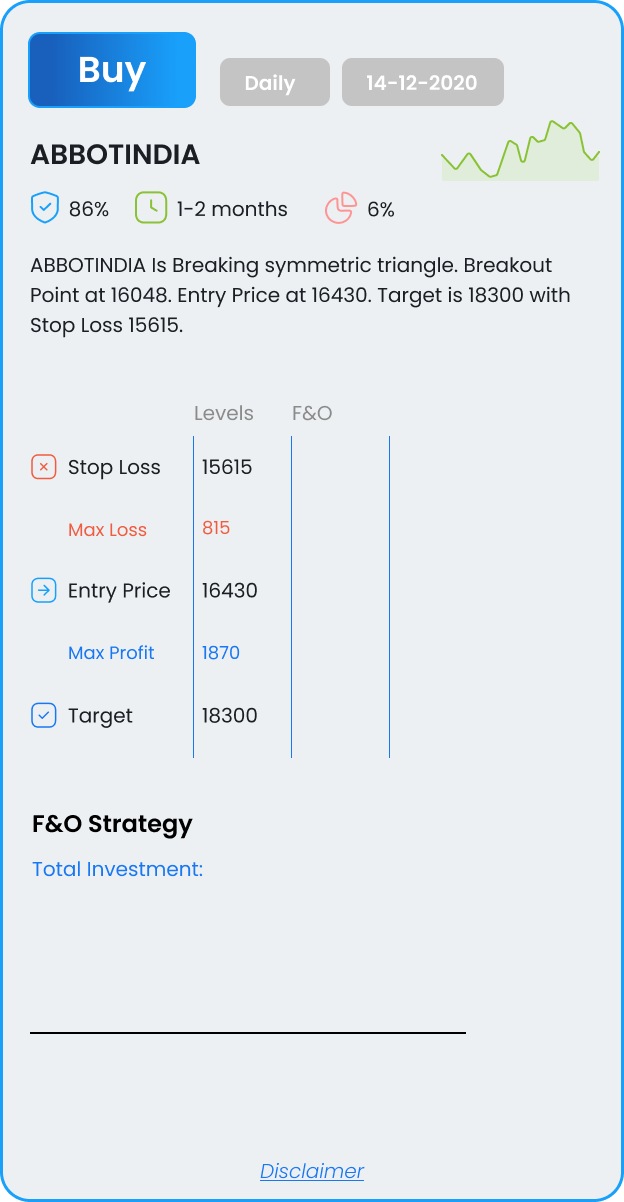
Is Breaking symmetric triangle. Breakout Point at 16048. Entry Price at 16430. Target is 18300 with Stop Loss 15615.
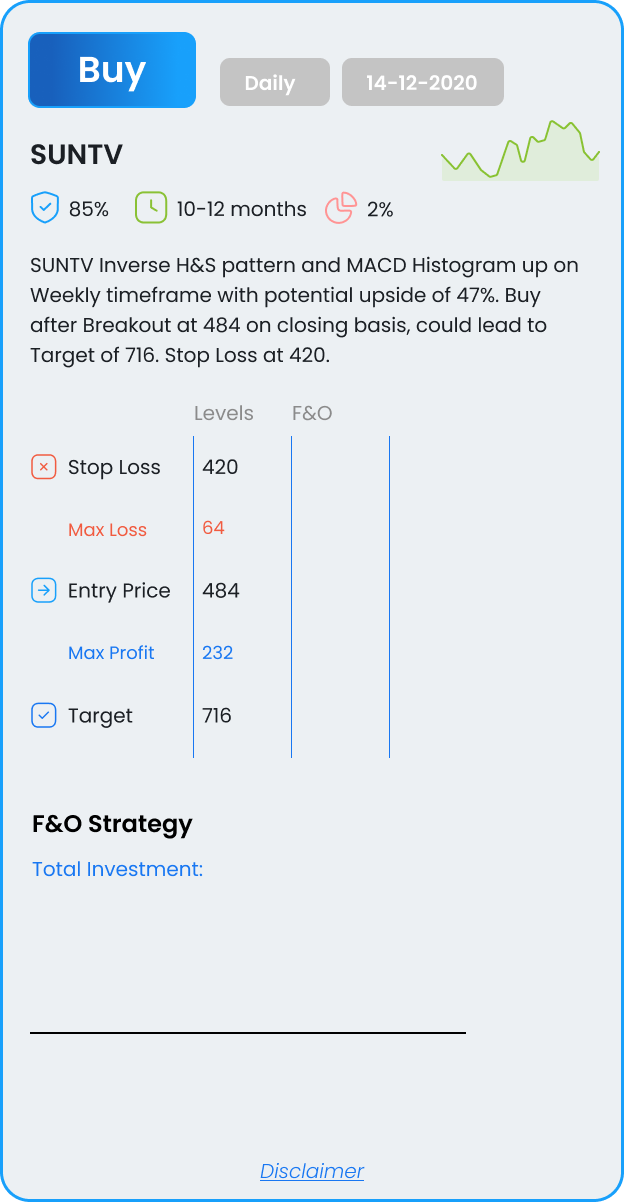
Inverse H&S pattern and MACD Histogram up on Weekly timeframe with potential upside of 47%. Buy after Breakout at 484 on closing basis, could lead to Target of 716. Stop Loss at 420.