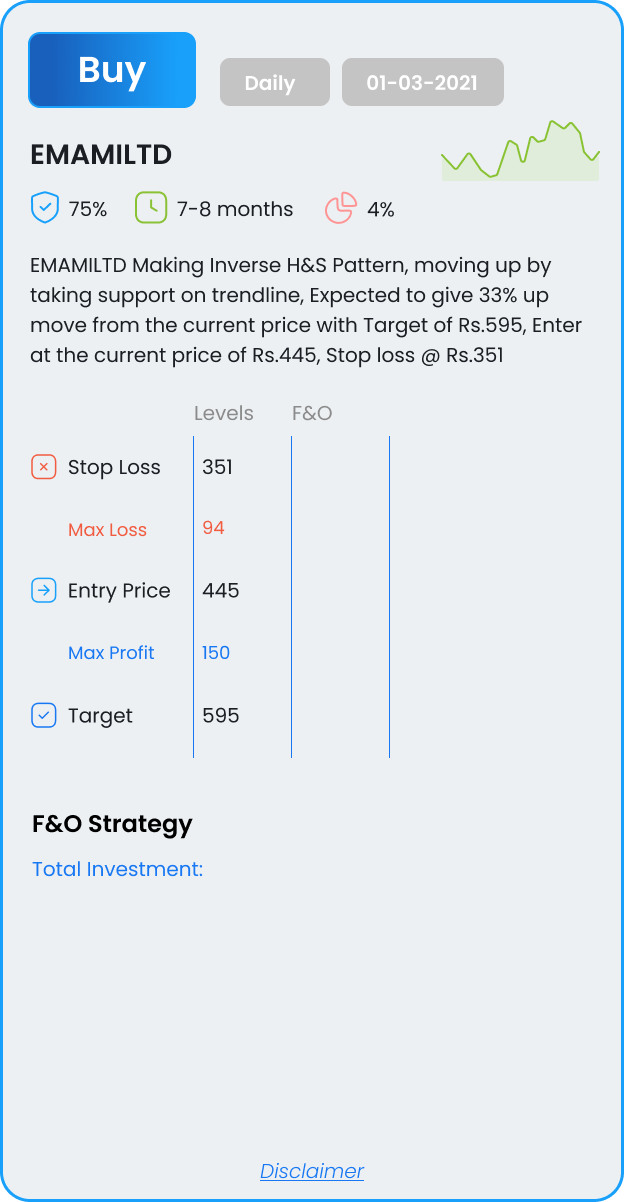
EMAMILTD
Making Inverse H&S Pattern, moving up by taking support on trendline, Expected to give 33% up move from the current price with Target of Rs.595, Enter at the current price of Rs.445, Stop loss @ Rs.351

Making Inverse H&S Pattern, moving up by taking support on trendline, Expected to give 33% up move from the current price with Target of Rs.595, Enter at the current price of Rs.445, Stop loss @ Rs.351
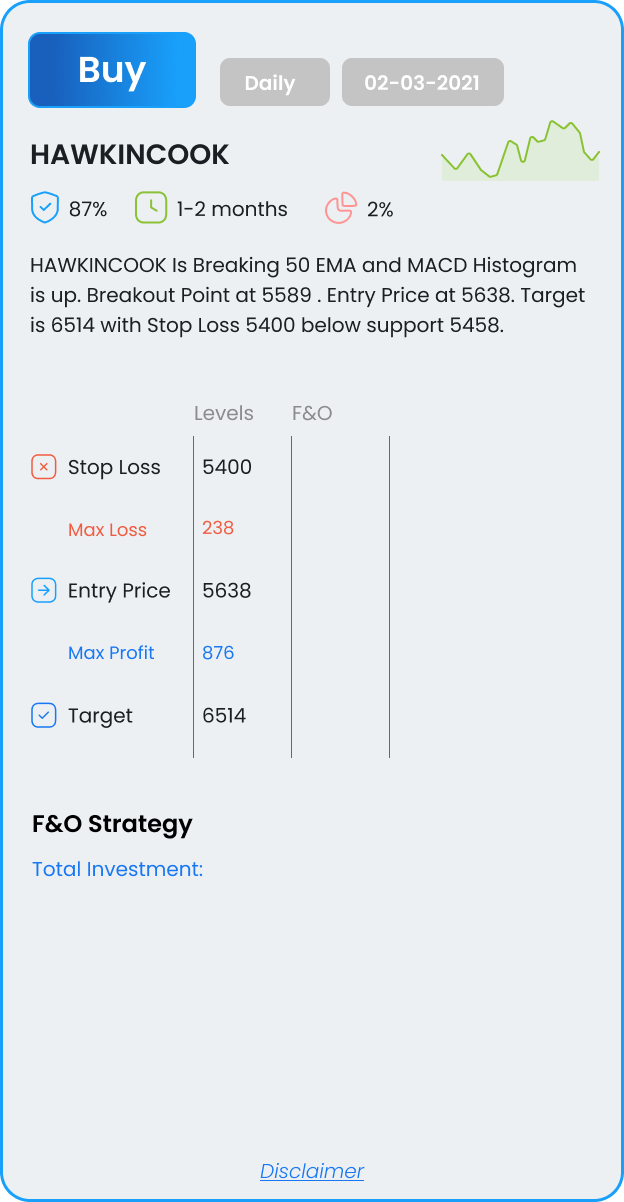
Is Breaking 50 EMA and MACD Histogram is up Breakout Point at 5589. Entry Price at 5638. Target is 6514 with Stop Loss 5400 below support 5458.
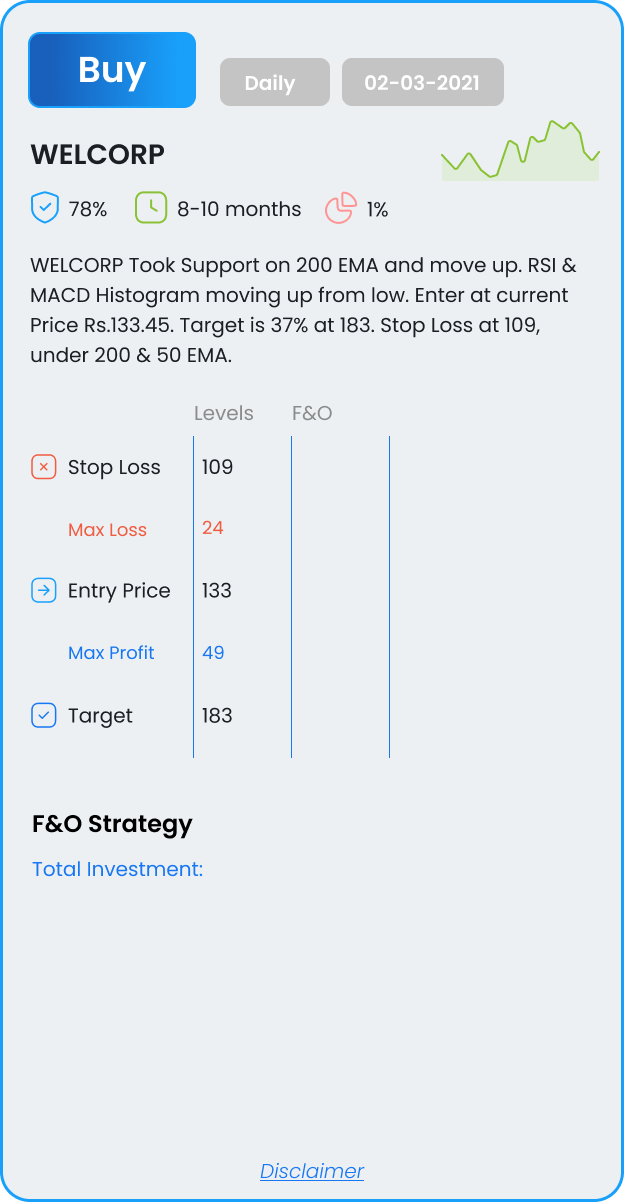
Took Support on 200 EMA and move up. RSI & MACD Histogram moving up from low. Enter at current Price Rs.133.45. Target is 37% at 183. Stop Loss at 109, under 200 & 50 EMA.
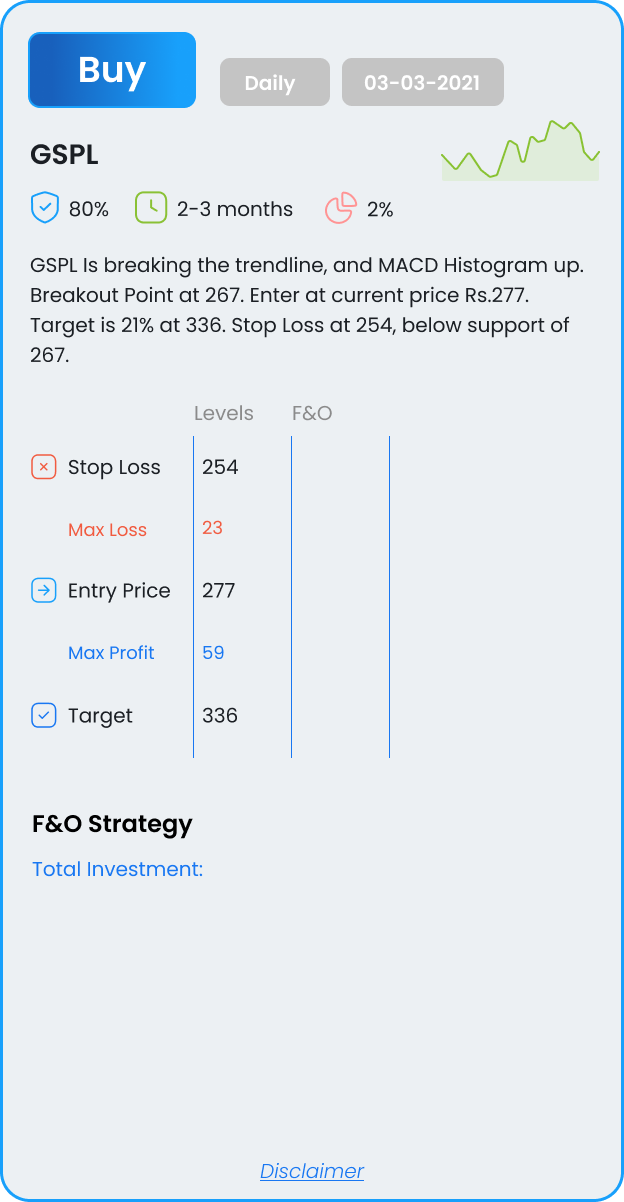
Is breaking the trendline, and MACD Histogram up. Breakout Point at 267. Enter at the current price of Rs.277. Target is 21% at 336. Stop Loss at 254, below the support of 267.
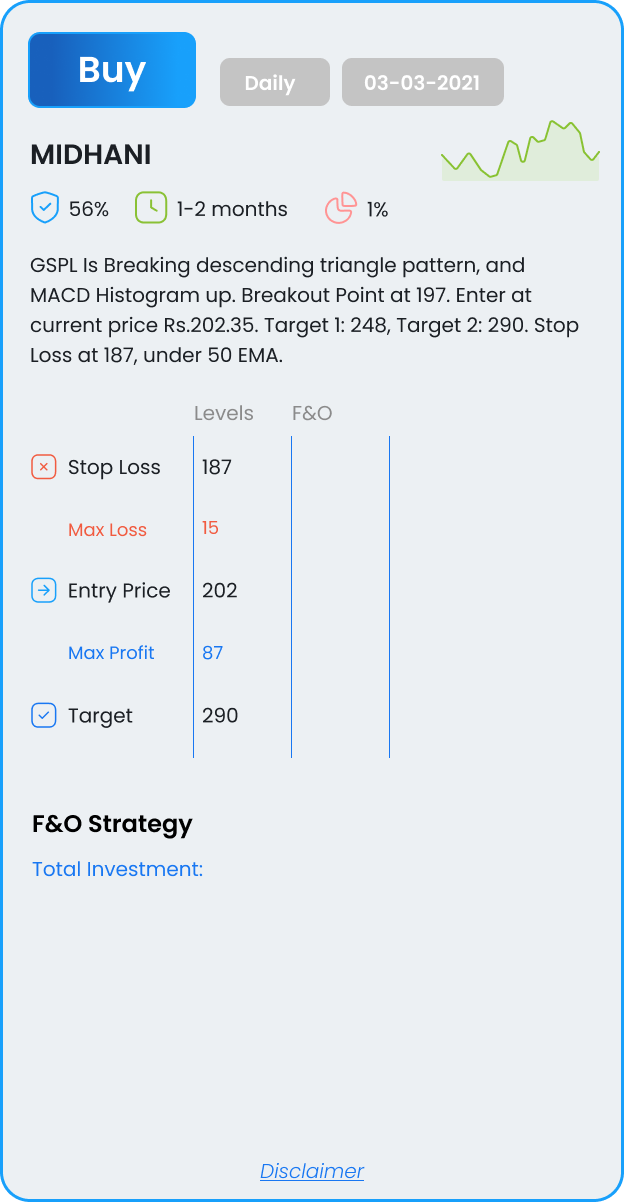
Is Breaking descending triangle pattern, and MACD Histogram up. Breakout Point at 197. Enter at the current price of Rs.202.35. Target 1: 248, Target 2: 290. Stop Loss at 187, under 50 EMA.
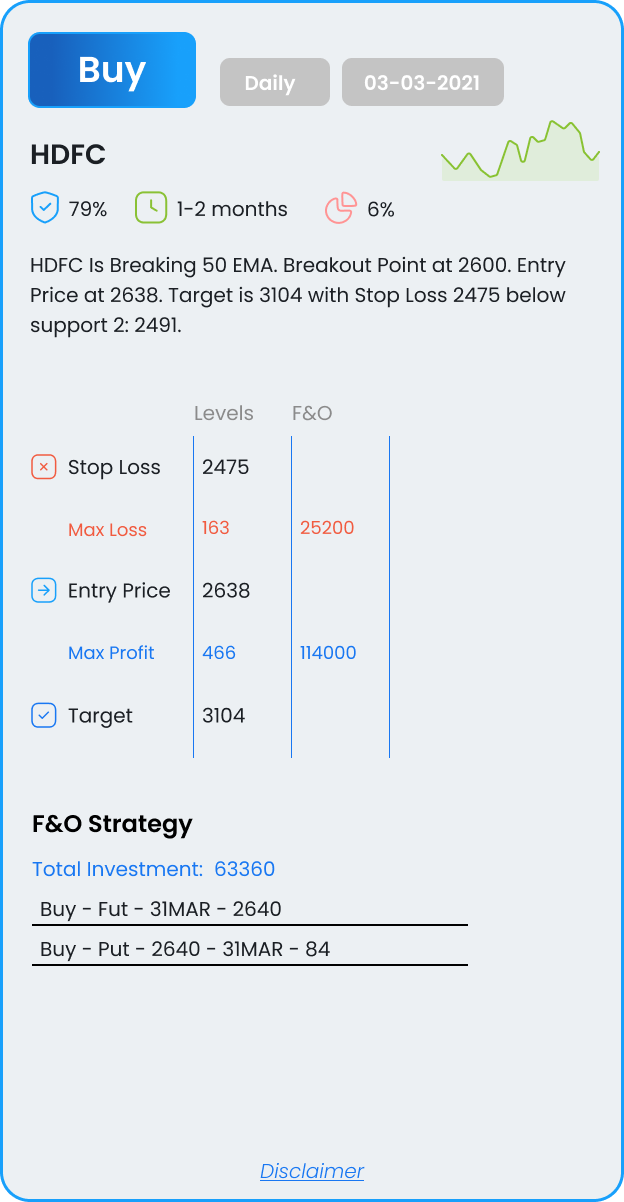
Is Breaking 50 EMA. Breakout Point at 2600. Entry Price at 2638. Target is 3104 with Stop Loss 2475 below support 2: 2491.
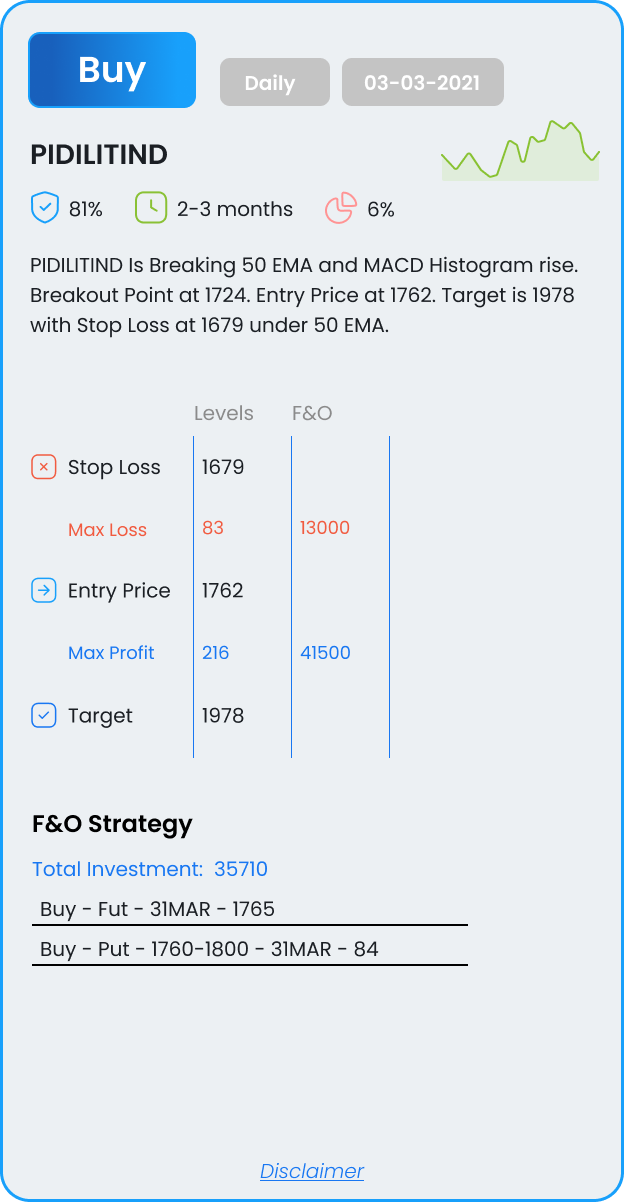
Is Breaking 50 EMA and MACD Histogram rise. Breakout Point at 1724. Entry Price at 1762. Target is 1978 with Stop Loss at 1679 under 50 EMA.
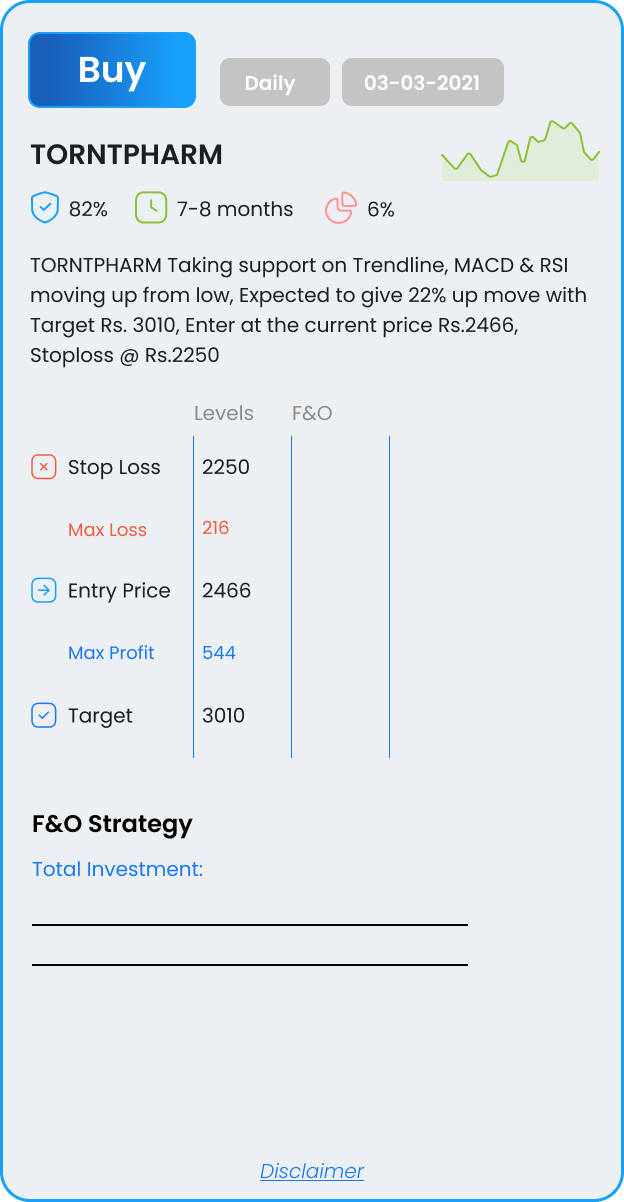
Taking support on Trendline, MACD & RSI moving up from low, Expected to give 22% up move with Target Rs. 3010, Enter at the current price Rs.2466, Stoploss @ Rs.2250
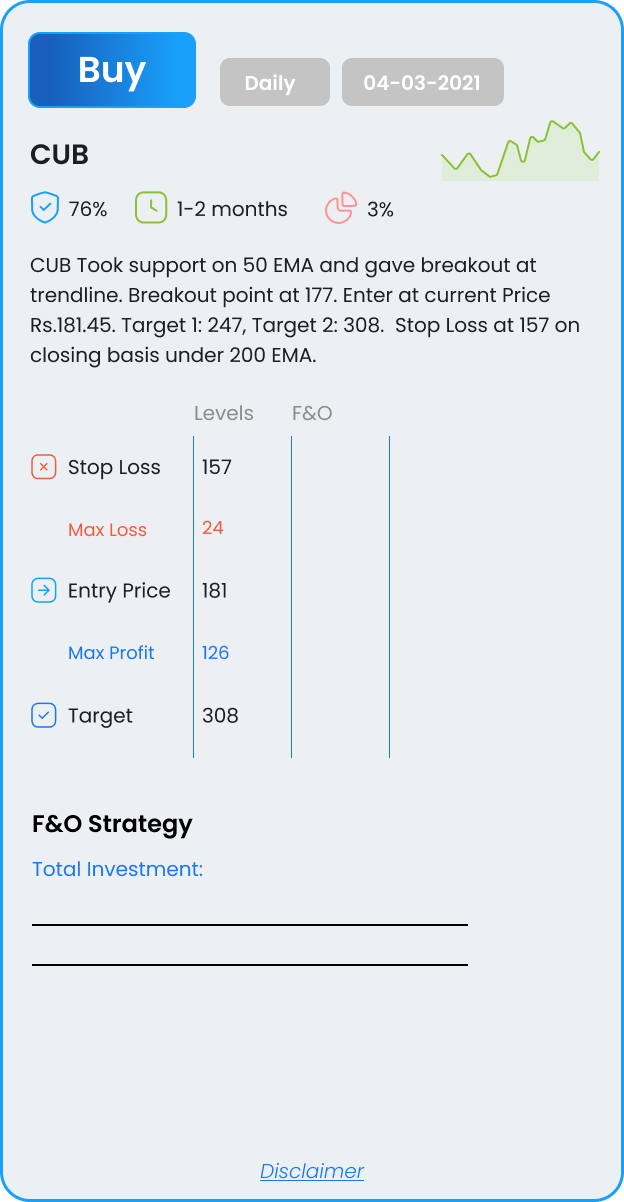
Took support on 50 EMA and gave breakout at the trendline. Breakout point at 177. Enter at the current Price Rs.181.45. Target 1: 247, Target 2: 308. Stop Loss at 157 on a closing basis under 200 EMA.
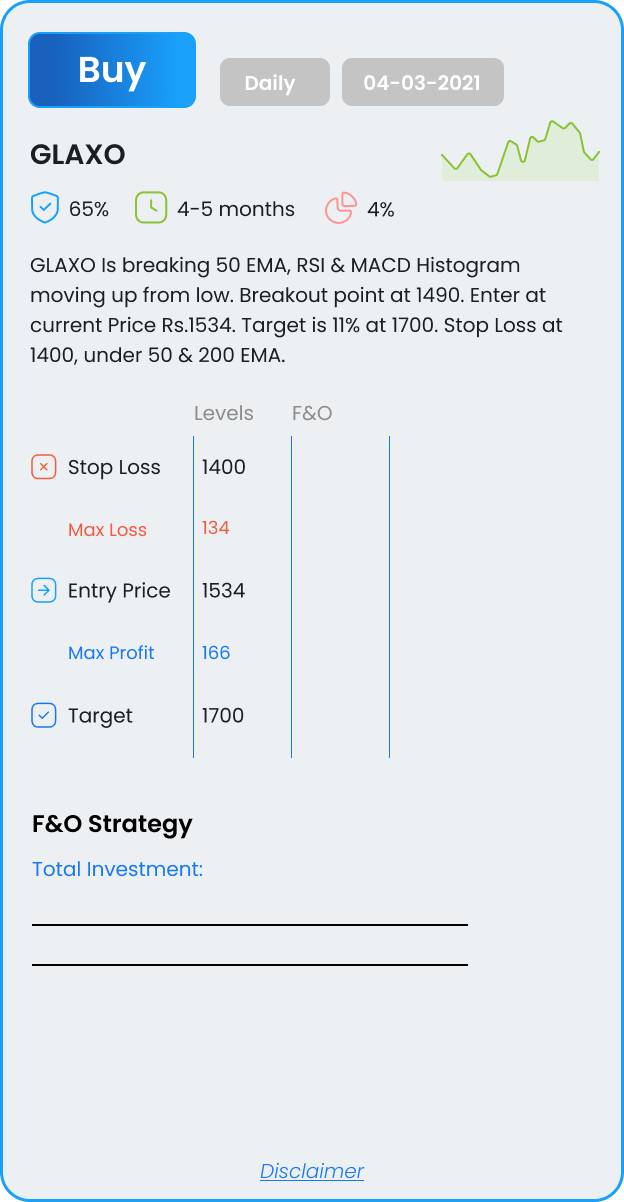
Is breaking 50 EMA, RSI & MACD Histogram moving up from low. Breakout point at 1490. Enter at the current Price of Rs.1534. Target is 11% at 1700. Stop Loss at 1400, under 50 & 200 EMA.